An Examination of Factors Affecting Individual Perceptions of Community Health
Kimberly M. Cassie, PhD., Anne & Henry Zarrow School of Social Work, University of Oklahoma
Melena Mayes, MSW., Administrative & Community Services, City of Lancaster, CA
Abstract
Background: To date, most assessments of community health have been based on objective measures of an area's health. However, little research has examined an individual's perception of their community's health and factors associated with those perceptions. This study considers the role demographics, personal characteristics and community characteristics have on individual perceptions of community health.
Methods: Based on data collected from a sample of 610 individuals from the greater Tulsa metro community, this research reports on conditions associated with community health.
Results: Results of stepwise regression analysis indicate age, income, personal health, bodymass index, self-care and neighborhood safety were statistically significantly associated with community health.
Conclusions: Older individuals, those with lower incomes, better personal health ratings, residing in neighborhoods perceived to be safe and those engaging in regular self-care activities reported better community health. Implications of these findings for public health practice and research in Oklahoma are discussed.
Key Words: community health, neighborhood safety, personal health, self-care, age, SES
Introduction
Perhaps at no other time in modern history has the perception of community health been more important than now. With the emergence of covid-19, life as we knew it in communities around the globe came to a stop. Health care systems, providers, researchers and policy makers scrambled to put in place a basic infrastructure to respond to mass rates of illness and mortality. As society begins to relax shelter in place orders and life returns to normal, individual perceptions of community health may affect daily decisions in a way many of us have never considered. For example, decisions about returning to work, vacationing, traveling or wearing face masks may be influenced by an individual's perception of their community's health. If an individual perceives their community as healthy they may be more likely to return to prepandemic activities, while those that perceive their community to be unhealthy may be less likely to return to previous activities or more likely to wear face masks or practice social distancing. Research is needed to examine this theory.
It is well established that community health is influenced by various determinants, including social, economic, cultural, environmental factors, as well as community and individual behaviors.1 Individual behaviors such as dietary choices, physical exercise, medication adherence and social determinants of health, such as poverty, neighborhood safety and walkability, education and the availability of health and social services are well established predictors of community health. Objective data on the state of health in Oklahoma suggests the health of communities in the state is lacking. Oklahoman's health has steadily declined in the last 20 years, with the state currently ranking 46th in the nation for overall health, down from 32nd place in 1990.2 The prevalence of diabetes and obesity have increased substantially in the state.2 However, little research has been done to study the relationships between an individual's perceptions of their community's health and overall health effects and behaviors despite emerging evidence that an association may exist.3-4
Some existing studies explore associated perceptions of neighborhood health with various factors such as demographics, individual health characteristics, or community characteristics. Several studies have looked at relationships between physical activity and perceived environment,5-9 as well as the effects of the perceived environment on self-rated health.10 However, most of the perceived environment variables focus on a community's physical attributes such as aesthetics and proximity to facilities, while overlooking socio-ecological attributes such as social cohesion; demographic attributes such as income and health insurance enrollment; and bio-psychological attributes such as mental health issues and diet. Studies that do expand potential contributing factors11-12 focus on populations outside of the United States or subpopulations within the United States and may not be generalizable to Oklahomans.
This leads us to several questions. Do subjective measures of community health align with objective measures of community health? Do Oklahoman's agree the health of their communities are poor? What factors are associated with perceived community health? Using data collected from a community health needs assessment in the spring 2019, this research attempts to address gaps in our understanding of perceived community health. This study considers the role demographics, personal characteristics and community characteristics have on individual perceptions of community health. Findings from this research can be used to inform practice and policy decisions.
Methods
Sample. Data for the assessment were drawn from a convenience sample of individuals (N= 610) recruited through social media in the greater Tulsa metro area in February/March 2019. The availability of the survey and invitations to participate were announced through Facebook, the Nextdoor app, and an email campaign targeting low-income households in the service area. Respondents completed an online survey that took about 20-30 minutes to complete. At the conclusion of the survey participants were given an opportunity to enter a drawing for one of four $100 gift cards.
Measures. The dependent variable of interest in this research was community health. To measure community health, respondents were asked to rate the health of their community based on a five-point scale with higher scores indicating more positive perceptions of the community's health. Independent variables of interest fell into three categories of variables: demographic variables, individual level predictors and community level predictors.
Demographics. Four demographic characteristics were considered: sex, age, income and health insurance. Respondents were asked to indicate the sex assigned to them at birth and their age in years. Categories for income were provided for participants. Income categories ranged from less than $10,000 annually to $150,000 and more. Respondents were asked, "What is your primary source of health care coverage?" A list of possibilities was provided including private health insurance plans, Medicare, Medicaid/Sooner Care and TriCare. An option was available for participants to indicate they did not have health insurance. Responses were coded into a bivariate variable with those having a private or federal/state health insurance coded as a 1 and those without insurance coded as a 0.
Individual level predictors. Individual level predictors included measures of depression and anxiety, social isolation, loneliness, stress, personal health, body mass index (BMI), self-care, exercise and diet. Anxiety and depression were measured using the Patient Health Questionnaire4 (PHQ-4), a brief 4-item screening instrument commonly used in health care settings. Scores range from 0-12 with higher scores indicating greater levels of depression and anxiety. Psychometric testing has revealed the PHQ-4 to be a valid and reliable instrument for measuring depression and anxiety among similar samples.13
Social isolation was measured with the Patient-Reported Outcomes Information System (PROMIS) Short Form v2.0 - Social Isolation 4a. The instrument contains four items asking respondents to rate the frequency in which they feel"...avoided, excluded, detached, disconnected from, or unknown by, others..."14 Raw scores were converted into standardized T-scores based on scoring guidelines. Prior research has established the instrument as a valid and reliable measure of social isolation among the English-speaking population in the US.15-16
Loneliness was measured with the 3-item Loneliness Scale.17 The scale asks participants the frequency with which they experience behaviors associated with loneliness. Higher scores indicate greater levels of loneliness. Previous research has found the instrument to be reliable with good internal consistency when compared to the use of the 20 item UCLA Loneliness Scale.17
The Stress Overload Scale Short Form is a valid and reliable 10-item instrument used to calculate a total stress measure and two domains of stress: personal vulnerability and event load.18 For the purposes of this research only the total stress measure was considered. Higher scores indicate greater levels of stress.18
To rate personal health, respondents were asked, "Would you say that in general your health is: excellent, very good, good, fair or poor?" Higher scores indicated a more positive self-evaluation of one's health. Respondents were asked to provide their weight in pounds and height in feet and inches without shoes. Height was converted into inches. BMI, based on guidelines from the Centers for Disease Control and Prevention,19 was calculated by dividing weight in pounds by height in inches and multiplying result by 703.
Respondents were asked, "Generally speaking, how often do you make time to relax or engage in self-care activities (such as participating in activities you enjoy or engaging in stress reducing activities other than TV)?" Responses were then coded into a binary variable with those participating in self-care regularly or always coded as 1 and other responses coded as 0.
Respondents were asked, "In a usual week, how many times do you exercise? - Moderate Exercise (fast walking, dancing, gentle swimming, golf, heavy housework or gardening)?" Responses were then coded into a binary variable with those participating with moderate activity three or more times a week coded as 1 and less frequent exercisers were coded as 0. Finally, respondents were asked, "Generally speaking, do you think you eat a healthy diet?" Those who responded yes, were coded as a 1 and negative responses were coded as 0.
Community level predictors. Two community level predictors were included in this study: social cohesion and perceived neighborhood safety. Social cohesion and trust were measured with five questions as discussed by Sampson, Raudenbush and Earls.20 Statements assessed participant perceptions regarding the degree to which their neighborhood is close knit, their neighbors are trustworthy and the extent to which neighbors share similar values. Possible responses were agreement, disagreement or a neutral option. Positive responses were coded as 1, negative statements as -1 and neutral statements as 0. Responses were summed. Possible scores ranging from -5 to +5 with higher scores indicating greater levels of social cohesion.
To measure neighborhood safety participants were asked three questions to assess the extent to which they perceived their neighborhood to be safe for walking, violence and crime that were previously used in research and found to be reliable by Tamayo and colleagues.21 Possible responses were agreement, disagreement or a neutral option. Positive responses were coded as 1, negative statements as -1 and neutral statements as 0. Responses were summed. Possible scores ranging from -3 to +3 with higher scores indicating greater neighborhood safety.
Analysis Plan
Data were analyzed using SPSS, version 24. Descriptive statistics were considered. Given the satisfaction of basic regression assumptions, a three-level stepwise linear regression model was used to examine the relationship between community health and independent variables. At the first level community health was considered as the dependent variable with demographic characteristics of the sample. At the second level, health and mental health factors were added to the model. At the third level, perceived neighborhood characteristics were added.
Results
Descriptive Statistics
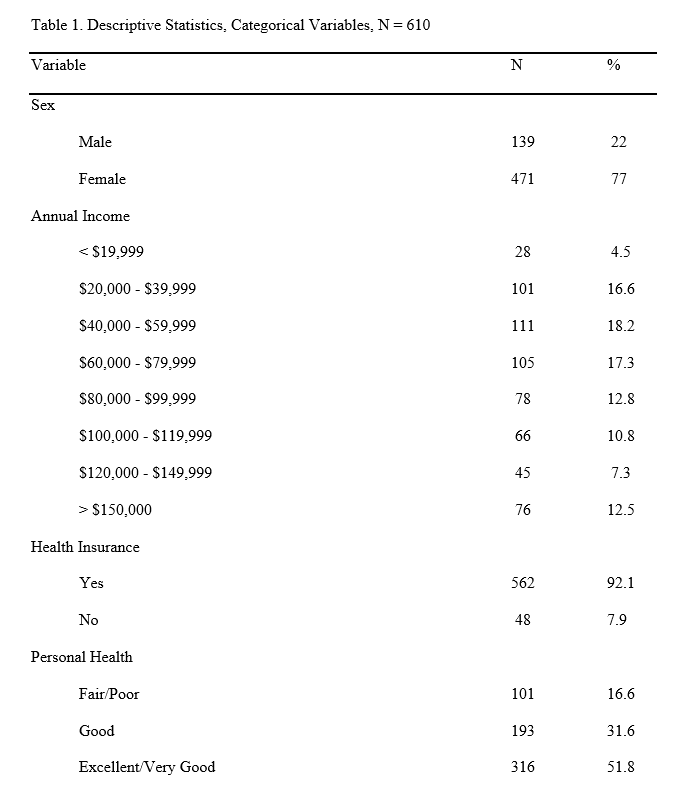
A total of 610 individuals provided complete information for the survey online. Participant ages ranged from 22 to 90 with a mean of 50.03 (SD = 15.52), suggesting most participants were between the ages of 35 and 66. As noted in Table 1, the majority of the sample was female (77%), while the remainder was male (23%). Individuals earning less than $39,999 annually represented 21% of the sample while those earning between $40,000 and $79,999 represented a little over a third of the sample. Those earning $80,000 and $119,999 represented 24% of the sample and those earning more than $120,000 represented about 20% of the sample. The majority of the sample had some form of health insurance (n = 562 or 92% compared to n = 48 or 8%)
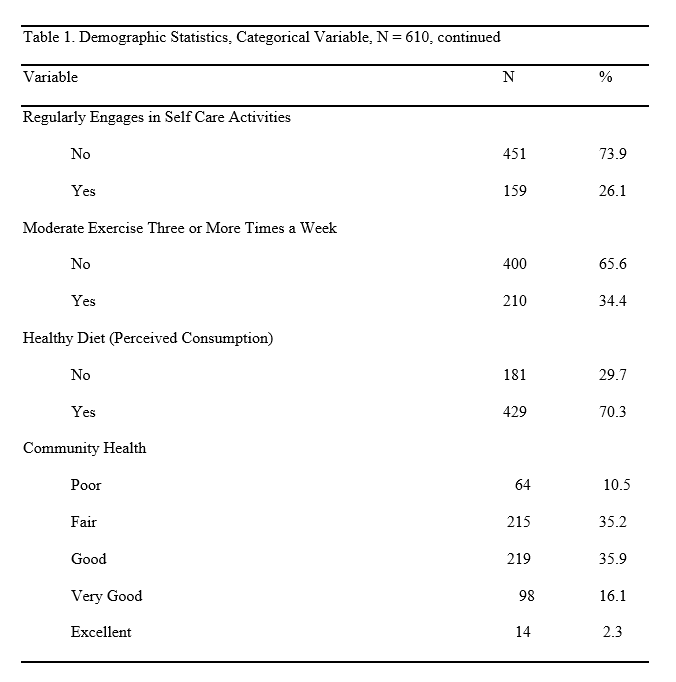
Just over half of the sample rated their community health as excellent, very good or good, while about a third rated their community health as fair and the remaining 11% rated their community health as poor. PHQ-4 scores ranged from 0-12 but tended to be low with a mean of 2.60 (SD = 2.69). Social isolation t-scores for participants ranged from 35 to 74 with a mean of 48.54 (SD = 8.79). Loneliness scores ranged from 3-9 with a mean of 4.64 (SD = 1.84). Stress scores ranged from 10-50 with a mean of 20.71 (SD = 9.31). Over half of participants rated their health as excellent/very good, almost a third as good and 17% rated their health as fair or poor. BMI ranged from 17-62 with a mean of 30.09 (SD = 7.80). Only about a third reportedly engaged in self-care activities on a regular basis. A little over a third of participants engaged in moderate exercise three or more times a week while 70% reported consuming a healthy diet.
Social cohesion scores ranged from -5 to +5 with a mean of 2.11 (SD = 2.35). Neighborhood safety scores ranged from -3 to +3 with a mean of 0.82 (SD = 1.96).
Characteristics Associated with Community Health
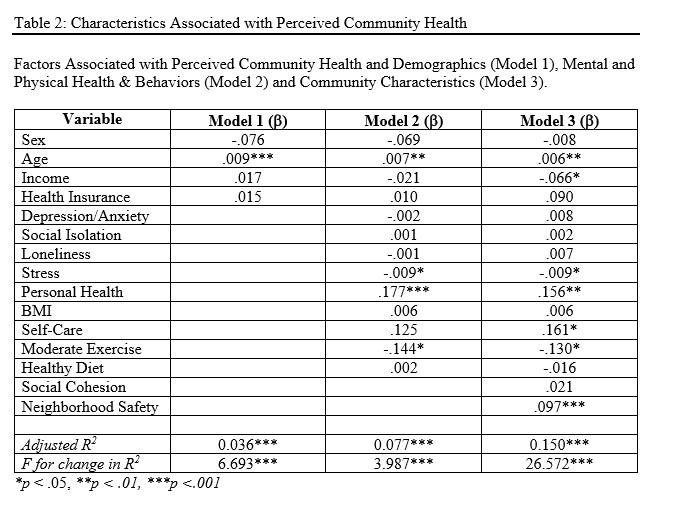
Table 2 indicates the findings at each step of the regression. Each of the models is a predictor of community health, accounting for 4% to 27% of the variance in community health. When demographic factors alone were considered in Model 1, statistically significant relationships were noted with better community health reported among older adults. When health and mental health characteristics were added in Model 2, statistically significant relationships were observed with better community health observed among older adults, those experiencing lower levels of stress, those reporting worse personal health and those not engaged in regular exercise. The addition of perceived community characteristics is shown in Model 3. Relationships observed in Model 2 remained and statistically significant relationships between community health and three additional variables emerged in the final model: income, self-care and neighborhood safety. More specifically, better community health was noted among older adults, those with lower incomes, those reporting worse personal health, those engaging in self-care regularly, those not engaged in regular physical activity and those in areas with positive levels of neighborhood safety
Discussion
This research offers greater insight into community health and factors associated with individuals' perceived ratings of their community's health. When demographic factors alone were considered in the first regression model, better assessments of community health were observed among older adults. This suggests older adults perceive the health of their communities more favorably than younger adults. Previous research suggests a disconnect between objective and subjective measures of health among older adults.22 For example, many older adults with multiple co-morbidities may view themselves as healthy, while objective measures of health and wellness would categorize them as less healthy. The same phenomenon may be at play in their assessments of community health.
When physical and mental health characteristics were added to the model, older adults continued to assess community health more positively than younger adults, but other statistically significant relationships emerged as well. Individuals experiencing less stress, those with more positive assessments of their personal health and those that did not engage in regular exercise rated the health of their community more positively than others. People experiencing greater stress may be more likely to view things more negatively23 which may transfer to views of their communities' health. Perceived stress has been associated with poor health.24 Similarly, objective methodology has noted a relationship between chronic stress and community health. Stress associated with community violence, inequality and severe poverty has been linked to a biological response to the allostatic load and can influence the way in which a community responds to acute and ongoing stressful situations.25
The interrelated connection between individual and community health is well established26 and is not surprising to see in this research. The relationship between exercise and community health is puzzling. It is well known that regular exercise is linked to better health for individuals and communities.27 However, according to the President's Council on Sports, Fitness and Nutrition, only one third of adults in the US participate in recommended levels of physical activity on a regular basis.28 The relationship between exercise and community health bears further research consideration.
The addition of perceived community characteristics in model three adds to our understanding of perceived community health. More specifically older adults, those with less income, those with less stress, those with better personal health, those engaging in regular self-care, those not engaging in regular physical activity and those residing in neighborhoods thought to be safer perceived the health of their communities as healthier than others. While it may seem intuitive that those with lower incomes are more likely to reside in communities with higher levels of crime and less access to health care resources, Chetty and colleagues found that the relationship between life expectancy and income was not clear cut. Instead health behaviors and community characteristics were more closely associated with life expectancy than income.29 This suggests individual and community level characteristics may be mitigating factors in perceived community health. Future research should consider the possibility of mediating effects.
Conclusion
This research adds to our understanding of Oklahomans' perspectives on community health. It is a timely topic to consider given that individual perspectives on community health are likely to drive individual behaviors and choices as society continues to look for ways to function effectively in a pandemic. While this paper does not directly address community health perspectives pertaining to covid-19, it can inform future studies that seek to examine individual perspectives on community health, safety and personal health related decisions regarding social distancing and the use of face masks.
This study is more indicative of responses from a sample made up of predominantly middle-class, female sample of participants with health insurance from the greater Tulsa area. Generalizability is limited. In addition, it is worth noting that the variance explained in perceived community health by the models examined is minimal, suggesting additional variables need to be considered to better understand what factors play into an individual's perception of their community's health. This research can be used by public health practitioners and researchers to better understand factors associated with perceived community health to address cognitive distortions and inform future research.
References
1. Fielding J, Kumanyika S, Evans WD, et al. The Secretary's Advisory Committee on national health promotion and disease prevention objectives for 2020: Recommendations for the framework and format of Healthy People 2020 (Phase I; Developing Healthy People 2020, p. 92). https://www.healthypeople.gov/sites/default/files/PhaseI_0.pdf. Accessed July 3, 2020.
2. United Health Foundation. America's Health Rankings Annual Report: 2019. https://assets.americashealthrankings.org/app/uploads/ahr_2019annualreport.pdf. Accessed July 3, 2020
3. Gary TL, Safford MM, Gerzoff RB, et al. Perception of neighborhood problems, health behaviors, and diabetes outcomes among adults with diabetes in managed care: The Translating Research into Action for Diabetes (TRIAD) study. Diabetes Care. 2008;31(2):273-278. doi. 10.2337/dc07-1111.
4. Severance JH & Zinnah SL. Community-based perceptions of neighborhood health in urban neighborhoods. J COMMUN HEALTH NURS. 2009;26(1):14-23. doi: 10.1080/07370010802605721.
5. Ding D, Sallis JF, Kerr J, Lee S, & Rosenberg DE. Neighborhood environment and physical activity among youth a review. AM J PREV MED. 2011;41(4):442-455. doi: 10.1016/j.amepre.2011.06.036.
6. Frost SS, Goins RT, Hunter RH, et al. Effects of the built environment on physical activity of adults living in rural settings. AM J HEALTH PROMOT. 2010;24(4):267-283. doi: 10.4278/ajhp.08040532.
7. King AC, Toobert D, Ahn D, et al. Perceived environments as physical activity correlates and moderators of intervention in five studies. AM J HEALTH PROMOT. 2006;21(1):24- 35. https://doi.org/10.1177/089011710602100106.
8. Poortinga W. Perceptions of the environment, physical activity, and obesity. SOC SCI MED. 2006;63(11):2835-2846. doi: 10.1016/j.socscimed.2006.07.018.
9. Shigematsu R, Sallis JF, Conway TL, et al. Age differences in the relation of perceived neighborhood environment to walking. MED SCI SPORT EXER. 2009;41(2):314-321. https://doi.org/10.1249/MSS.0b013e318185496c
10. Cummins S, Stafford M, Macintyre S, Marmot M, & Ellaway A. Neighbourhood environment and its association with self-rated health: Evidence from Scotland and England. J EPIDEMIOL COMMUN H. 2005;59(3):107-213. doi: 10.1136/jech.2003.016147.
11. Duncan M, & Mummery K. Psychosocial and environmental factors associated with physical activity among city dwellers in regional Queensland. PREV MED. 2005;40(4):363-372. doi: 10.1016/j.ypmed.2004.06.017.
12. Evenson KR, Sarmiento OL, Tawney KW, Macon ML, & Ammerman AS. Personal, social, and environmental correlates of physical activity in North Carolina Latina immigrants. AM J PREV MED. 2003;25(3 Suppl 1):77-85. doi: 10.1016/s07493797(03)00168-5.
13. Mills SD, Fox RS, Pan TM, Malcarne VL, Roesch SC, & Sadler GR. Psychometric evaluation of the Patient Health Questionnaire-4 in Hispanic Americans. HISPANIC J BEHAV SCI. 2015;37(4):560-571. doi:10.1177/0739986315608126.
14. PROMIS. (2015). Social Isolation. http://www.healthmeasures.net/images/PROMIS/manuals/PROMIS_Social_Isolation_Sc oring_Manual.pdf. Accessed July 3, 2020.
15. Carlozzi NE, Ianni PA, Lange RT, et al. Understanding health-related quality of life of caregivers of civilians and service members/veterans with traumatic brain injury: Establishing the reliability and validity of PROMIS social health measures. ARCH PHYS MED REHAB. 2019;100(4S):S110-S118. doi: 10.1016/j.apmr.2018.06.026.
16. Hahn EA, DeWalt DA, Bode RK, et al. New English and Spanish social health measures will facilitate evaluating health determinants. HEALTH PSYCHOL. 2014;33(5):490-499. doi:10.1037/hea0000055.
17. Hughes ME, Waite LJ, Hawkley LC. & Cacioppo JT. A short scale for measuring loneliness in large surveys: Results from two population-based studies. RES AGING 2004;26(6):655-672. doi: 10.1177/0164027504268574.
18. Amirkhan JH. (2018). A brief stress diagnostic tool: The short Stress Overload Scale. Assessment, 2018;25(8):1001-1013. doi: 10.1177/10731911116673173.
19. Centers for Disease Control and Prevention. About Adult BMI. https://www.cdc.gov/healthyweight/assessing/bmi/adult_bmi/index.html#Interpreted. Accessed July 3, 2020.
20. Sampson RJ, Raudenbush SW, & Earls F. Neighborhoods and violent crime: A multilevel study of collective efficacy. Science, 1997;277;918-924. doi: 10.1126/science.277.5328.918.
21. Tamayo A, Karter AJ, Mujahid MS, et al. Associations of perceived neighborhood safety and crime with cardiometabolic risk factors among a population with Type 2 Diabetes. HEALTH PLACE. 2016; 39:116-121. doi: 10.1016/j.healthplace.2016.03.007.
22. Cho J, Martin P, & Poon LW. Successful aging and subjective well-being among oldestold adults. Gerontologist, 2015;55(1):132-143. doi: 10.1093/geront/gnu074.
23. Shields GS, Toussaint LL & Slavich GM. Stress related changes in personality: A longitudinal study of perceived stress and pessimism. J RES PERS. 2016; 64:61-68. doi: 10.1016/j.jrp.2016.07.008.
24. Kaplan SA, Madden VP, Mijanovich T, & Purcaro E. The perception of stress and its impact on health in poor communities. J COMMUN HEALTH. 2013;38(1):142-149. doi: 10.1007/s10900-012-9593-5.
25. Chandra A, Cahill M, Yeung D & Ross R. Measuring Community Stress. Robert Wood Johnson Foundation. https://www.rwjf.org/en/library/research/2018/09/measuringcommunity-stress.html. Accessed July 3, 2020.
26. Arah OA. On the relationship between individual and population health. MED HEALTH CARE PHIL. 2009;12(3);235-244. doi: 10.1007/s11019-008-9173-8.
27. Centers for Disease Control and Prevention. At-A-Glance. https://www.cdc.gov/physicalactivity/downloads/Active_People_Healthy_Nation_at-a- glance_082018_508.pdf. Accessed July 3, 2020.
28. U.S. Department of Health & Human Services. Facts & Statistics. https://www.hhs.gov/fitness/resource-center/facts-and-statistics/index.html. Accessed July 3, 2020.
29. Chetty R, Stepner M, Abraham S, et al. The association between income and life expectancy in the United States, 2001-2014. JAMA, 2016;315(16):1750-1766. doi:10.1001/jama.2016.4226.