Economic Impacts of COVID-19 on Revenues of the State of Oklahoma
James D. Hess, Ed.D., Oklahoma State University Center for Health Science
Introduction
The arrival, presence and spread of the 2019 novel coronavirus (COVID-19) in the State of Oklahoma (State) initiated a cascade of economic impacts and consequences not witnessed since the Great Depression. As the State reacted to the continuing spread of the virus through mandatory shelter-in-place orders, the gross revenues in varying forms of taxes and fees collected by the State declined rapidly. The purpose of this paper is to describe the chronology and economic impact of COVID-19 on the collection of certain tax and fee revenues within the State of Oklahoma from January 1, 2020 through January 31, 2021.
COVID-19 Chronology
The first case of COVID-19 was reported in Tulsa County on March 6, 2020.1 At the time of the reporting, no community spread had been detected. The first death attributed to COVD-19 was reported on March 19, 2020.2 Over the next several weeks, the number of cases increased steadily. The Mayors of Oklahoma City and Tulsa issued mandatory shelter-in-place orders for their cities on March 28, 2020, following the Governor's safer-at-home order for the elderly and sick the same week.3
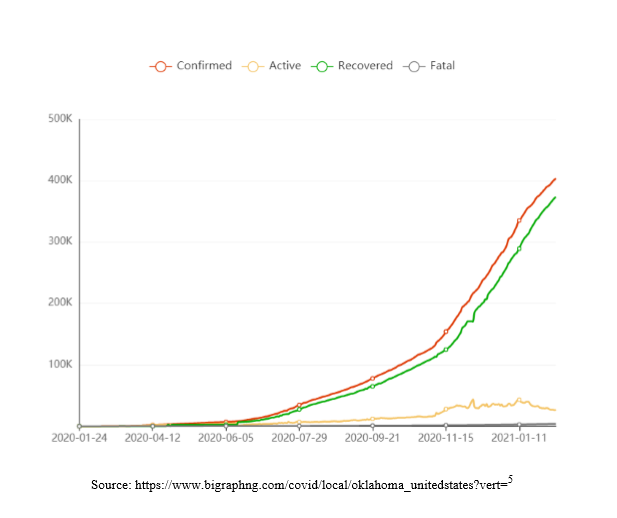
The number of COVID-19 cases grew steadily over the next several months, reaching its highest point in January of 2021.4 The 7-day average of new cases peaked at 4,256 on January 13, 2021, and the 7-day average of new deaths reached its apex at 65 on January 27, 2021.4 The following figure charts the growth in cases over the past 11 months.5
Figure 1
Economic Impact on State Revenues
Prior to the first reported case of COVID-19, the State Treasurer's office predicted the State's revenues would be virtually the same as the previous fiscal year (2019).6 Having no idea COVID-19 would become a pandemic, the Treasurer's Office reported in January 2020, "the equalization board met on December 20, 2020, and certified a preliminary estimate for FY-21. The estimate of $8.34 billion is virtually flat from the current FY-20. It is up by $9.4 million, or 0.1 percent." 6 The Treasurer's Office report for February 2020 was equally optimistic, outlining the total revenue for the previous year. "Gross revenue totals $13.73 billion from the past 12 months, February 2019 through January 2020. That is $660.2 million, or 5.1 percent, above collections from the previous 12-month period."7 It is worth repeating that at the time of these reports, no cases of COVID-19 had been detected within the State.
As the prevalence of COVID-19 increased, business activity was negatively affected by the numerous shelter-in-place and shutdown orders enacted. This reduction in economic activity resulted in a dramatic decrease in the volume of taxes and fees collected by the State. The Treasurer's Office report for May 2020 stated "May gross collections total $923.1 million, down by $150.5 million, or 14 percent, from May 2019."8 The state's unemployment rate at that time stood at 14.7% compared to 3.2% from the year before.8
The following figures detail the dramatic decrease in gross receipts of tax and fee revenue as well as the unemployment rate for the period May 2019 to May 2020.
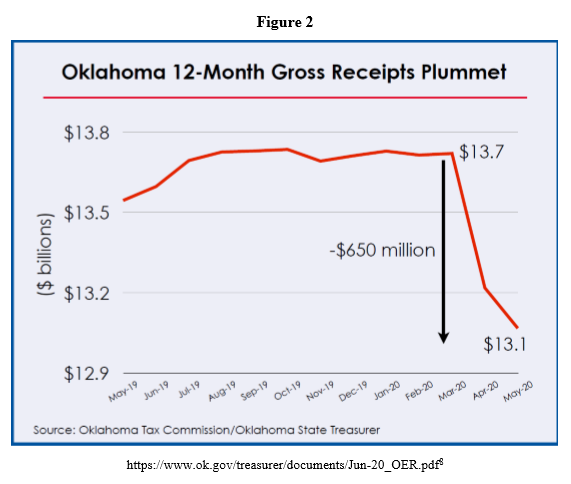
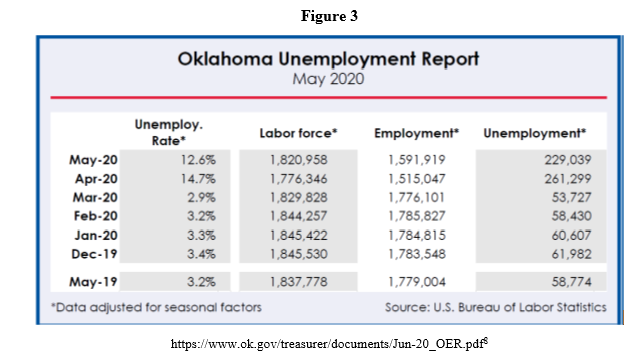
The most accurate representation of the economic impact of COVID-19 on the State's revenue is the comparison of total revenue for the twelve-month period February 2020 to January 2021 to revenue totals for the period February 2019 to January 2020. Total state revenue for that period of time dropped by 610.4 million, or 4.4 percent.9. The performance of revenue in each of the tax and fee categories for the same twelve-month period is listed below.
• Gross revenue totals $13.12 billion. That is $610.4 million, or 4.4 percent, below collections from the previous period.
• Gross income taxes generated $4.73 billion, a decrease of $34.2 million, or 0.7 percent.
• Individual income tax collections total $4.08 billion, down by $99.4 million, or 2.4 percent.
• Corporate collections are $650.1 million, an increase of $65.2 million, or 11.1 percent.
• Combined sales and use taxes generated $5.48 billion, a drop of $112.5 million, or 2 percent.
• Gross sales tax receipts total $4.68 billion, down by $182.7 million, or 3.8 percent.
• Use tax collections generated $798.4 million, an increase of $70.2 million, or 9.6 percent.
• Oil and gas gross production tax collections generated $599.3 million, down by $415.3 million, or 40.9 percent.
• Motor vehicle collections total $774.2 million, a decrease of $18.2 million, or 2.3 percent.
• Other sources generated $1.54 billion, down by $30.1 million, or 1.9 percent.
• Medical marijuana taxes generated $58.2 million, up by $31.1 million, or 114.6 percent.9
Not surprisingly, the only two tax categories generating increases in the comparison of preCOVID-19 to the COVID-19 period were online sales taxes (use tax) and medical marijuana taxes. The revenue category suffering the greatest loss was gross production taxes collected from the oil and gas industry on actively producing wells.9
The oil and gas tax industry has historically contributed a significant portion of the State's revenue as well as serving as a major employment category. The impact of COVID-19 on the oil and gas industry was manifested in the dramatic decrease in gross production taxes. As economic activity both within the State as well as across the rest of the country floundered, the consumption of oil and gas decreased dramatically. Gross production taxes from oil and gas fell by $415 million or 41% during COVID-19.9 Figure 4 below details the drop in gross production taxes.
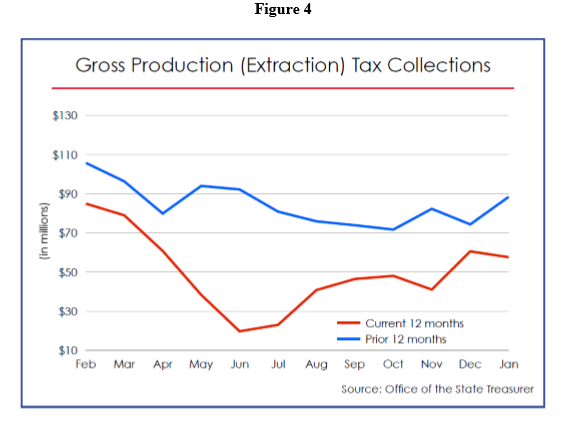
Source: https://www.ok.gov/treasurer/documents/Jan-21-GRT-OER.pdf9
Steady Recovery for State Revenue
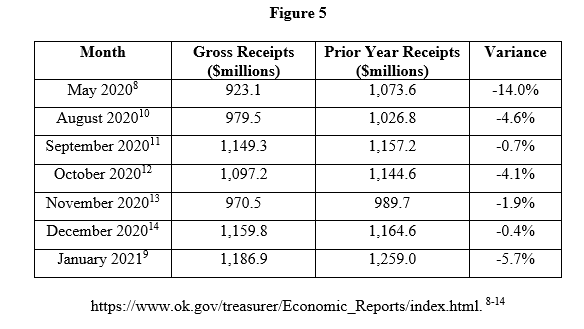
The State's revenue collections increased significantly from May 2020 to January 2021, although the data reveals some month to month variance. The revenues for May 2020, during the apex of the shelter-in-place orders, were 14% below the prior year, while the January 2021 revenues were only 5.7% below the prior year totals.8,9 The figure below outlines the recovery of gross receipts from May 2020 to January 2021 by measuring variances from the prior year for each month (June, July reports unavailable). 8-14
The State's revenue collections may continue to recover over the coming months as the prevalence of vaccine increases. As the level of vaccination of the State's population increases, additional study of the economic impacts of COVID-19 on the collection of taxes and fee revenue will be warranted.
References
1. https://www.tulsa-health.org/news/tulsa-health-department-reports-first-case-covid-19
2. https://www.tulsa-health.org/news/tulsa-health-officials-confirm-first-covid-19-deathoklahoma
3. https://www.usnews.com/news/best-states/oklahoma/articles/2020-03-28/officials-15people-with-covid-19-in-oklahoma-have-died
4. https://usafacts.org/visualizations/coronavirus-covid-19-spread-map/state/oklahoma
5. https://www.bigraphng.com/covid/local/oklahoma_unitedstates?vert=
6. https://www.ok.gov/treasurer/documents/Jan-20_OER.pdf
7. https://www.ok.gov/treasurer/documents/Feb-20_OER.pdf
8. https://www.ok.gov/treasurer/documents/Jun-20_OER.pdf
9. https://www.ok.gov/treasurer/documents/Jan-21-GRT-OER.pdf
10. https://www.ok.gov/treasurer/documents/Aug-20-GRT-OER.pdf
11. https://www.ok.gov/treasurer/documents/Sep-20-GRT-OER.pdf
12. https://www.ok.gov/treasurer/documents/Oct-20-GRT-OER.pdf
13. https://www.ok.gov/treasurer/documents/Nov-20-GRT-OER.pdf
14. https://www.ok.gov/treasurer/documents/Dec-20-GRT-OER.pdf