Assessing the Characteristics of Preclinical Medical School Course Exams to Support Curricular Improvement: a Proof-of-Concept Analysis
Nicholas B. Sajjadi, BSc., Office of Medical Student Research, College of Osteopathic Medicine, Oklahoma State University Center for Health Sciences, Tulsa, Oklahoma
Joseph Price III, PhD., Department of Pathology, College of Osteopathic Medicine, Oklahoma State University Center for Health Sciences, Tulsa, Oklahoma
Conflicts of Interests: The authors declare no potential conflicts of interest related to the current work.
Abstract
Background
Examinations consisting of multiple-choice questions are the mainstay of formative and summative assessments in preclinical medical education, however, exam items are subject to poor composition and require performance analysis to optimize. The primary objective of this study was to devise and implement a proof-of-concept analysis focusing on normality testing as useful for test-writing development, informing curricular decisions, and supporting student progress.
Methods
We examined 63 exam datasets from the 2019-2020 academic year at the Oklahoma State University College of Osteopathic Medicine that included 4 variables: exam scores, item difficulty, item discrimination index, and item point biserial. We aimed to assess normality for each variable graphically with Q-Q plots and numerically using the Shapiro-Wilk test and Benjamini-Hochberg procedure for adjustment.
Results
Q-Q plots analysis of the 63 exam data sets revealed evidence of non-normality for 57 exam score sets, 58 item difficulty sets, 37 item discrimination sets, and 9 point-biserial sets. Comparably, Shapiro-Wilk testing suggested non-normally distributed data for 58 for exam scores sets, 59 item difficulty sets, 40 item discrimination index sets, and 4 for point biserial sets.
Conclusions
Many exams at our institution had non-normally distributed variables, and the assumption of normality for future inferential statistical methods is not necessarily supported. We recommend that future investigators perform normality testing before proceeding with statistical analysis, the results of which will inform the choice of statistical methods. Further study is required to elucidate important causal factors that may lead to non-normal distributions, and consideration of when non-normality might be expected or even desirable.
Introduction:
Examinations are an important component of medical education that, when administered properly, can assist in accomplishing the goals of undergraduate medical curricula.6 Examinations motivate students to study deeply and broadly, and in this way, can fill instructional gaps and strengthen study habits.6,9 The study habits developed in preclinical years have direct crossover into studying for standardized clerkship exams, when exposure to high-yield topics and experiences can vary greatly from student-to-student.6 Examinations also offer a tenable way to measure the core medical competencies of students.21 Lastly, examinations are sources of important feedback for students as they progress through the curriculum, demonstrating areas of proficiency that can be refined or areas of weakness that can be bolstered.17,19 However, the feedback process is not limited to students, and the proper analysis of exam performance allows instructors and exam writers to continuously improve the quality of exam items.3,17
Exams consisting of multiple choice questions have been the mainstay of formative and summative assessments of student competency in preclinical medical education, and the same format is used for nationally standardized board and licensure exams.4,21Multiple choice exams are useful because they can be easily standardized and can cover a broad range of topics, making them ideal for testing large groups.1 However, multiple choice exam items are subject to poor composition and often only test the student’s ability to recall isolated facts rather than testing information synthesis, critical thinking, or knowledge application.21 Moreover, most medical school faculty are not formally trained in writing multiple choice items that test higher order material,5 confining many exam items to the “recall question” category as defined by the National Board of Medical Examiners (NBME).6 Thus, the balance between creating a standardizable assessment that also tests more than rote memorization skills can be difficult to achieve. Achieving this balance in preclinical course exams is important, as the national board exams are increasingly interested in testing higher order medical judgment rather than random recall.11
Analyzing exam data can provide the feedback necessary for professors and curriculum writers to ensure assessments are well-written and to inform decisions on curricular development. However, the usefulness of analyzing course performance depends on the quality, validity, and reliability of course exams. Excessively “easy” exams may overpredict future performance, while excessively “hard” exams may under predict it. Moreover, exams that do not assess “board relevant” material may be misleading entirely, and exams that do not allow room for the creative expression and clinical expertise of teaching faculty may not adequately prepare students for the “real world.” As such, developing ways to analyze exam performance meaningfully and systematically is vital for supporting effective teaching and curricular strategies. A formal process has not been established at this institution, nor to our knowledge have such results across a curriculum been published for medical schools.
The primary objective of this study was to devise and implement a proof-of-concept analysis for assessing medical school exams as useful for test and faculty development, informing curricular decisions, and supporting student progress. In this report, as a beginning step, we provide a first look with descriptive statistics at four variables in exam data sets, including a focus on normality
testing. The normality of an analyzed data set is generally considered an important issue to guide the future choice of analytical methodologies for inferential statistics. In this way we provide groundwork for later studies that might do inferential statistical comparative and multi-year extensive analysis in an environment of evolving lists of participating faculty and exams whose composition changes each year.
Methods
Background Information
Exam analysis begins by considering overall score outcomes and by assessing the performance of individual questions, or “items.”14 Exam items can be analyzed in many ways, but Item Difficulty, Discrimination Index, and Point Biserial are common and useful metrics.14 Item difficulty ranges from 0% to 100% and represents the percentage of test-takers that answered the item correctly.13 Item difficulty is usually presented as a decimal value corresponding to the percentage and has different ideal values (to maximize discrimination among test takers) depending on the structure of a multiple choice question. For example, the theoretical ideal item difficulty for a 5-response multiple choice question may be .70, slightly higher than midway between chance and perfect scores for the item. The ideal value for a 2-response (i.e., True-False) item may be .85, with ideal in these contexts meaning the maximum ability to discriminate students based on exam performance.12,20 In the former example, the 2-response question having a higher item difficulty value indicates that the question is “easier” because purely random guessing would result in 50% of the class answering correctly, while the 5-response item would have 20% correct with random guessing and would correspond to a lower item difficulty value by default.
Discrimination index is the difference in item performance between top performing students and bottom performing students, typically the upper and lower 27th percentiles respectively, divided by the number of students in the larger of the 2 groups. 14 If the lower 27% of the class is selected as the denominator, the resulting value has negative validity, meaning that the question actually decreases the validity of the entire test.23 The higher the discrimination index, the better that item is at distinguishing top performers from low performers. Items with discrimination index greater than or equal to .4 are considered very good items while values between .39 and .3 are good but may benefit from improvement. Items with discrimination index values between .20 to .29 are fair items and require minor revisions, and items below .19 are considered poor, requiring major revision or complete elimination.8 If an item has a negative discrimination index (less than zero), it is likely that the item covers complex material that is written in a way that allows selecting the correct response without any real understanding of the topic at hand. 14 Items with negative discrimination values should be eliminated, as would items for which the class as a whole scored poorly.
Point biserial, sometimes referred to as “point biserial correlation” is a Pearson Product Moment type correlation between correct responses to an item and total scores on all other items. A 100% correlation suggests that high-scoring students answered the question correctly while low-scoring students answered the question incorrectly. Therefore, point biserial is used as a measure of the predictive value of an item on overall test performance.14 Values range from -1 to 1, where a value of -1 indicates a perfectly negative correlation, and a value of 1 indicates a perfectly positive correlation.
Maximizing the ability of an item to discriminate high performers from low performers is important for norm-based testing like national board exams. However, most classroom-based assessment at medical schools focuses on a specific criteria to monitor class progress, thus the goals are different than that of board exams.15,16 Situations can vary from a skills practicum to a lecture exam where the class average should be very high with little discrimination in scores among test takers. As a result, all the above interpretations would be altered subjectively by the exam evaluator and the setting for the specific situation.7
Data Collection and Cleaning
63 exam score datasets from the 2019-2020 academic year for the Class of 2022 and the Class of 2023 at Oklahoma State University College of Osteopathic Medicine were recorded, de-identified, then analyzed using the software suite R (version 4.0.2) and the integrated interface RStudio (Version 1.3.959). We obtained the data with consent and from the Office of Educational Development at the Oklahoma State University Center for Health sciences. We obtained the raw data for exam scores, item difficulty, item discrimination index, and item point biserial. Each exam was given a unique identifier as a categorical variable. For example, the second exam in the Human Anatomy course was identified as “anat 2” and the third exam was “anat 3,” and so on. We also included the semester that each exam was administered, the course type, and the number of credit hours for each course. The 5 course types classified by our curriculum are as follows: Biomedical Foundations (BMF), Clinical Care Foundations (CCF), Systems Course, Osteopathic Manipulative Medicine (OMM), and Focus Course. The data were first manipulated into CSV file format and then imported to RStudio.
Data Exploration and Descriptive Statistics Analysis
After collecting and cleaning, raw data was graphically explored using the package “tidyverse”22 and its included package “ggplot2” with extensions from the "ggthemes" package (Version 4.2.4). We plotted the raw data for exam scores, item difficulty, discrimination index, and point biserial.
Summary Statistics
We used native base R statistics functions with rapportools (version 1.0) to determine the summary statistics for these 4 variables, including the mean, median, standard deviation, skewness, and kurtosis. Skewness and kurtosis are sensitive to normality. Skewness is interpreted via the following definition: skewness = +/- 0.5 is minimally skewed; -1 < skewness < -0.5 or 0.5 < skewness < 1 is moderately skewed; skewness < -1 or skewness > 1 is highly skewed. Kurtosis is presented as excess kurtosis, defined as kurtosis minus 3 (normal distributions have a kurtosis of 3). The excess kurtosis can either be positive (leptokurtic) indicating a centrally peaked distribution with fat tails, negative (platykurtic) indicating a flattened distribution with thin tails, or equal to zero (mesokurtic) indicating kurtosis like that of a normal distribution.12 Based on the summary statistics, we may expect that the datasets display some degree of non-normality. Knowing the distribution characteristics of the variables informs inferential statistical analysis, since some methods require the assumption of normality for accurate interpretation. In the case of non-normal distributions, other methods (typically "non-parametric") are used. We used the commonly used approach of one graphical method and one numerical method to assess distribution characteristics, Q-Q plots and Shapiro-Wilk tests respectively. Using 2 methods to assess normality favors a more robust assessment.
Q-Q plots are classically used to graphically analyze deviation from normality, as they are not subject to the same potential bias as the Shapiro-Wilk test.10 Q-Q plots take a dataset, determine the mean and standard deviation, generate a theoretical dataset with the same parameters that is normally distributed, and compare the actual dataset to the theoretical one. The theoretical dataset is plotted as a line surrounded by a 95% confidence interval. The actual data are plotted as points that either fall on the line, off the line but within the confidence interval, or outside of the confidence interval. Points outside of the confidence intervals demonstrate statistically significant deviations from normality, as does curvature at the ends of plots. We generated Q-Q plots using the package “ggqqplot,” with the extension “ggpubr.”
The Shapiro-Wilk test was used because Monte Carlo simulations have shown that it is sufficiently powered for a given significance value, and the relatively small sample size for our exam datasets is acceptable for the Shapiro-Wilk test.18,24 The Shapiro-Wilk test has a null hypothesis of normality. Therefore, p-values less than .05 indicate statistically significant deviations from normality. The p-values from the Shapiro-Wilk test should be adjusted for bias arising from the problem of multiplicity. We used the Benjamini-Hochberg procedure for adjustment, which is more powerful than other methods that control the family-wise false discovery rate.2 We used the function “shapiro.test” in R along with the “p.adjust(method=BH)” function to accomplish the aforementioned analysis and adjustment.
Preliminary Inferential Statistical Analysis
Based on preliminary data analysis, we used nonparametric inferential statistical methods that could accommodate non-normally distributed data. The Kruskal-Wallis and Dunn tests with the "bh" correction were done with the FSA package (version 0.9.1), which provides both (FSA::dunnTest()) and uses the dunn.test (version 1.3.5) library. We looked for differences in the exam score and item variables based on categorical variables. Determining which variables are associated with differences in exam and item performance may support a focused approach to curricular refinement. We performed Kruskal-Wallis tests on exam scores, item difficulty, discrimination index, and point biserial after grouping by course type, semester, and credit hours.
Results
Raw Data and Summary Statistics
The raw data for exam scores, item difficulty, discrimination index, and point biserial are shown in Figure 1, and the descriptive statistics for raw data are presented in Table 1.

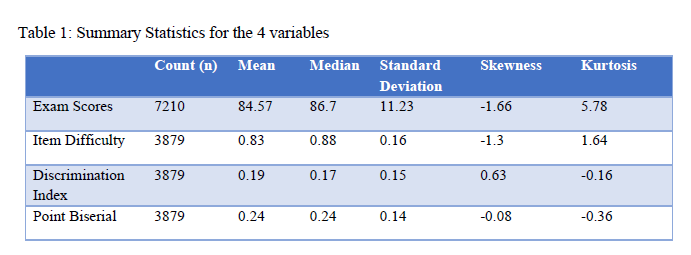
Inspection of the raw data plots (Figure 1) and summary statistics (Table 1) for exam scores reveals that the majority of exam scores are grouped towards the higher end of the distribution, with an obvious tail on the lower side of the distribution that may influence the normality of the curve. The possible non-normality of exam scores is also highlighted by the skewness and kurtosis values, which suggests that there are meaningful deviations from a normal curve. Inspection of the raw item variable data reveals that many test items fall outside of the ideal range for respective parameters as discussed previously. Item difficulty has a leftward tail on the distribution, whereas the discrimination index and point biserial have a more uniform grouping in the middle of the range. Item difficulty has a negative skew, which is represented by the leftward tail, and the skewness and kurtosis of the other 2 variables are mild in comparison. It is important to note that there were 4 instances where a student received the score of zero on an exam. These are likely instances where a student missed an exam or did not take an exam. The data provided are final and are representative of data used to calculate class rank. Thus, we elected to keep the data in the analysis and not treat these instances as outliers. Moreover, there are only 4 instances out of thousands of points, and their influence on the overall trend is minimal.
Normality Testing
The results for the Q-Q plot analysis for each variable of the 63 exams are presented in Figure 2. We found that 57 exams had score sets falling off of the line in a pattern or outside the confidence interval, suggesting that the majority of exams had non-normally distributed score profiles. For item difficulty, 58 exams had points falling off of the line in a pattern or outside of the confidence interval. For item discrimination, 37 exams had points outside of the interval. For point biserial, only 9 exams had deviations. These findings are in keeping with predictions made from descriptive statistics such that exam scores and item difficulty had a significant portion of non-normality, item discrimination was still non-normal by majority, and point biserial was largely normal.
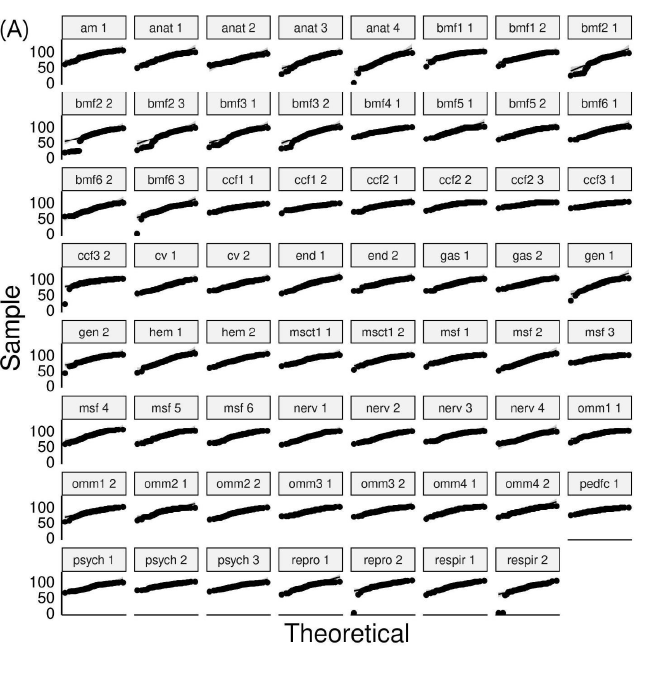
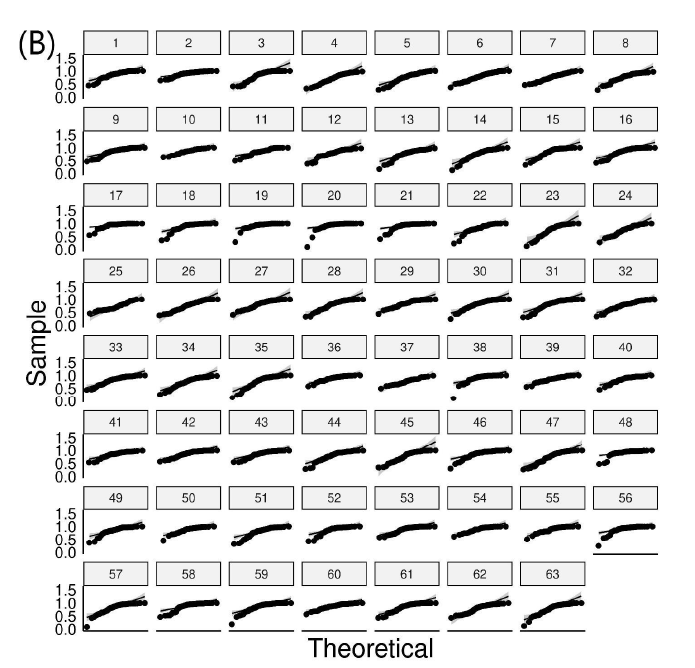
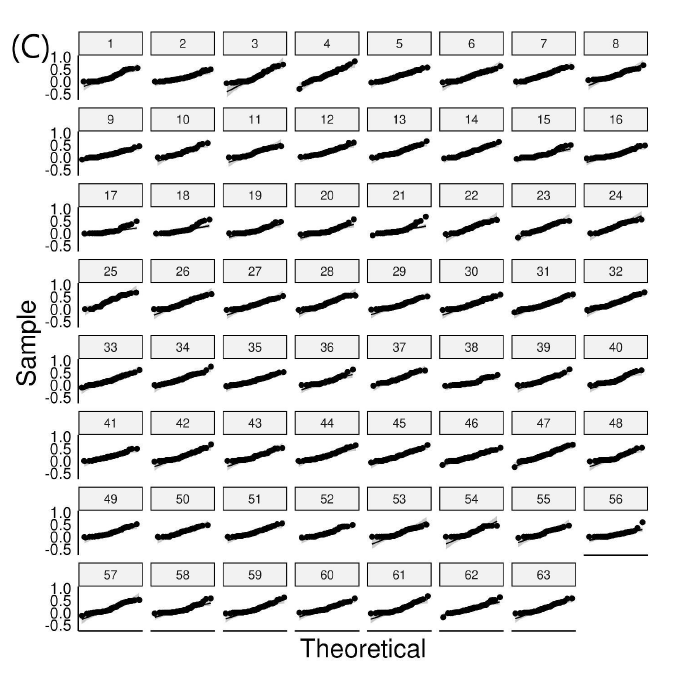
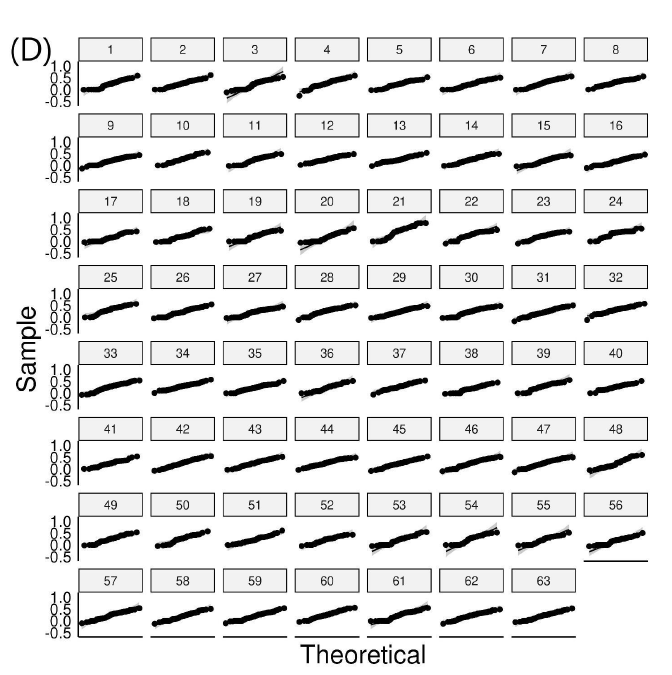
Figure 2: Q-Q plots for exam variables (A) score distributions, (B) item difficulty, (C) discrimination index, and (D) point biserial. Points falling off of the black line in a pattern or outside of the gray-scale confidence interval represent significant deviations from normality.
Based on the Shapiro-Wilk test for Normality with subsequent Benjamini-Hochberg adjustment, with p-values less than 0.05 as a significance criterion, the following numbers of exams out of the 63 total were not normally distributed for each of the four parameters: 58 for exam scores (92.06%), 59 for item difficulty (93.7%), 40 for discrimination index (63.5%), and 4 for point biserial (6.35%). Shapiro-Wilk test results for exam score sets and the 3 item variables are found in Figures 3 and 4.
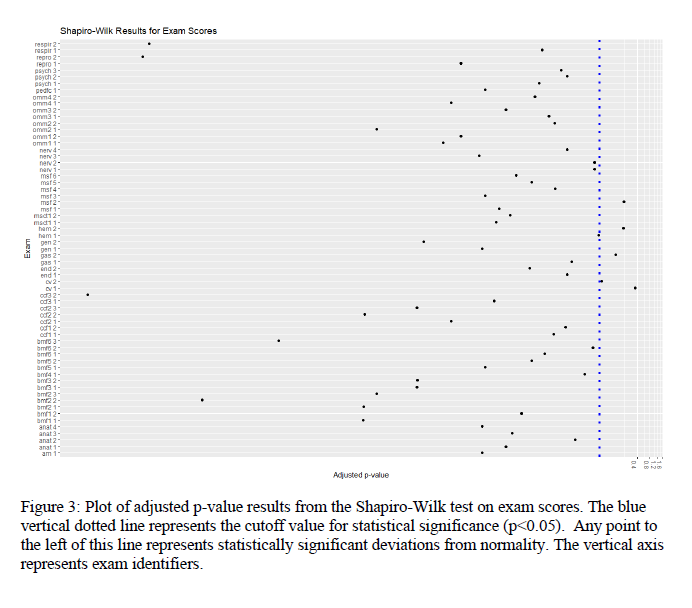
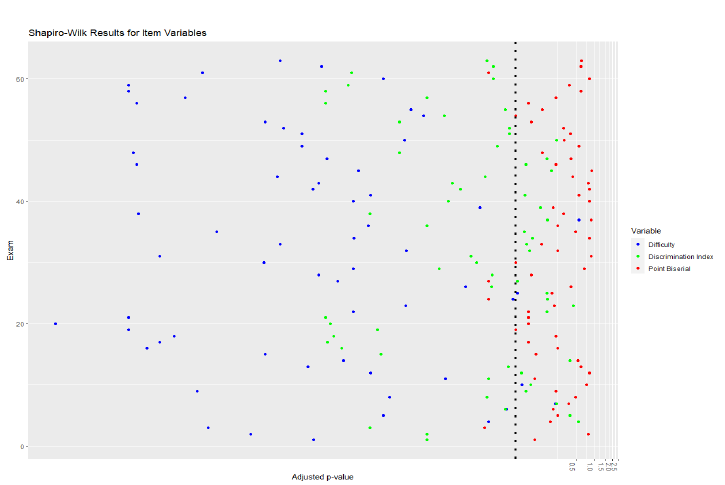
Figure 4: Plot of adjusted p-value results from the Shapiro-Wilk tests on item difficulty, discrimination, and point biserial data. The blue vertical dotted line represents the cutoff value for statistical significance (p<0.05), thus, any point to the left of this line represents statistically significant deviations from normality. The vertical axis represents exam identifiers numerically.
The results from the Q-Q plot analysis essentially matched that of the Shapiro-Wilk test and had acceptable congruence. Therefore, we can conclude that exam scores and item difficulty on any given exam was most likely to be non-normally distributed, discrimination index was less likely to be non-normally distributed and point biserial was least likely to be non-normally distributed.
Initial Inferential Statistics
For exploration of the exam data with some intuitive groupings, Kruskal-Wallis Rank Sum Tests for non-parametric comparisons for each variable were done with Dunn tests for pairwise comparisons. We chose several intuitive ways among many to group the data and look for a significant effect of grouping: by number, course type, or individual exam. The course types were: Basic medical foundations, Clinical Foundations, Focus, Osteopathic Manual Medicine, Systems Biology. The adjusted p values for the Kruskal-Wallis tests were reported by the FSA package as “0" for student scores grouped by course number, course type, or individual exam. For the three item variables testing for an effect of the same grouping variables, the p values were .01 or lower. This indicates that each of the grouping variables has a significant effect on the data tested. Dunn tests of pairwise comparisons with the Benjamini-Hochberg correction (data not shown) indicated which groups seemed to differ from others, and showed inconsistent dispersion of groups, and are omitted for clarity and brevity. Also, these may well vary from year to year. Such comparisons and further inferential analysis, when appropriate, are left to later studies.
Discussion
General Findings
Our results suggest that the majority of exams in our sample had statistically significant deviations from normal distributions regarding exam scores and item difficulty. Fewer item discrimination index datasets were non-normally distributed, and very few point biserial sets were non-normally distributed as assessed graphically and numerically. Preliminary inferential analysis indicates statistically significant effects of grouping by number, course type, or individual exam.
Raw Data and Summary Statistics
We noted many exam items falling far below their respective ideal ranges as defined in the methods section of this manuscript. It is important for instructors to review underperforming questions and critically revise them or remove them entirely. It is likely that close inspection of item contents may reveal aspects of the question that led to under performance, and adjustments can be made accordingly. We recommend the use of vetted and validated tools for question writing, such as those put forth by the NBME.6 Vanderbilt et al performed a review of test items administered at their medical institution and determined whether items met high quality criteria,21 and a similar approach may improve question quality at our institution. However, performance on test items is also influenced by presentation of the material to students, which should also be explored by respective instructors.
Additionally, it is important to note that the variables in our sample demonstrated varying degrees of non-normality as demonstrated by skewness and excess kurtosis. Therefore, summary statistics may be helpful in indicating which variables are likely to be non-normally distributed, though summary statistics alone are not sufficient to confirm distribution characteristics details. In the case of non-normally distributed data, future investigators may wish to perform inferential statistics using non-parametric tests. However, we refrain from recommending the automatic use of non-parametric tests without performing the normality testing as demonstrated in our manuscript, as the data distributions are likely to change from year-to-year, and by variable.
Normality Tests and Inferential Statistics
It is important to note the congruence between the Q-Q plot analysis and the Shapiro-Wilk test of normality, which together support our findings and make them more robust. Nearly all exams had non-normally distributed scores, though this is to be expected based on previous work. Of the 3 item variables, item difficulty had the most instances of non-normal distribution by exam, followed by discrimination index and point biserial. Therefore, the ability for performance on an individual item to predict the overall outcome of the test as indicated by point biserial occurred along normal distributions in most instances. In contrast, the ability item difficulty generally was not-normally distributed, with significant negative skew. This finding suggests that many questions may be excessively “easy,” although there can be a place for simple recall questions to certify students have learned key take away information. The significance of the aforementioned findings warrants further investigation and careful consideration. Depending on the situation, classroom exams for medical students in our institution tend to be criteria based, which may lead to abnormalities in exam statistics. In the second year, students are more homogeneous, which might be expected to result in less non-normal distribution of scores. However, non-normality in exam set variables is diffuse and pervasive throughout all courses. While inferential statistics were not the main focus of the current study, future investigators should pursue further inferential analysis to ascertain important differences that may support curricular improvement, as supported by our preliminary inferential analyses.
Strengths and Limitations
Strengths of our study include being the first of its kind to be performed at our institution. We have demonstrated that the assumption of normality for exam set variables is likely invalid and have recommended the use of non-parametric tests in this case. However, our study is not without limitations. Firstly, we only used one year's worth of data, to which the applicability of our findings is limited, although we expect other years to behave similarly. Secondly, as it is beyond the scope of this initial study, we did not exhaustively perform inferential statistics which could reveal important relationships, though future studies should seek to investigate these relationships. Lastly, our study is cross-sectional in nature and cannot suggest causality. Many unmeasured factors could influence the few differences in our sample, and our results should be interpreted accordingly.
Conclusions
We sought to examine the distribution characteristics of 4 variables used to explore exam qualities at our institution with a focus on normality testing. Many exams at our institution had non-normally distributed variables, and the assumption of normality for inferential statistical methods is not supported. We recommend that future investigators perform normality testing before proceeding with further statistical analysis, the results of which will inform the researcher on the proper statistical tools and interpretations. Further study is required to elucidate important causal factors that may lead to non-normal distributions, and consideration of when non-normality might be expected or even desirable.
Acknowledgements
The authors gratefully acknowledge the retrieval and supply of the raw data for this project by Jessica Rucker from the Office of Educational Development at the Oklahoma State University Center for Health sciences. Similarly acknowledged are the consultations on statistics with professors Dr. Joshua Habiger, and Dr. Pratyaydipta Rudra, with Dr. Price.
References:
1. Bauer D, Holzer M, Kopp V, Fischer MR. Pick-N multiple choice-exams: a comparison of scoring algorithms. Adv Health Sci Educ Theory Pract. 2011;16(2):211-221. doi:10.1007/s10459-010-9256-1
2. Benjamini Y, Hochberg Y. Controlling the false discovery rate: A practical and powerful approach to multiple testing. J R Stat Soc. 1995;57(1):289-300. doi:10.1111/j.2517-6161.1995.tb02031.x
3. Bierer SB, Dannefer EF, Taylor C, Hall P, Hull AL. Methods to assess students’ acquisition, application and integration of basic science knowledge in an innovative competency-based curriculum. Med Teach. 2008;30(7):e171-e177. doi:10.1080/01421590802139740
4. Brenner JM, Bird JB, Willey JM. Formative Assessment in an Integrated Curriculum: Identifying At-Risk Students for Poor Performance on USMLE Step 1 Using NBME Custom Exam Questions. Acad Med. 2017;92(11S Association of American Medical Colleges Learn Serve Lead: Proceedings of the 56th Annual Research in Medical Education Sessions):S21-S25. doi:10.1097/ACM.0000000000001914
5. Bridge PD, Musial J, Frank R, Roe T, Sawilowsky S. Measurement practices: methods for developing content-valid student examinations. Med Teach. 2003;25(4):414-421. doi:10.1080/0142159031000100337
6. Case SM, Swanson DB. Constructing Written Test Questions for the Basic and Clinical Sciences. National Board of Medical Examiners Philadelphia, PA; 1998. https://medicine.iua.edu.sd/images/nbme_guide-1.pdf
7. Crocker LM, James Algina. Introduction to Classical and Modern Test Theory. New York : Holt, Rinehart, and Winston; 1986.
8. Ebel RL, Frisbie DA. Using test and item analysis to evaluate and improve test quality. Essentials of educational measurement (4th ed , pp 223-242) Englewood Cliffs, NJ: Prentice-Hall. Published online 1986.
9. Evans DJR, Zeun P, Stanier RA. Motivating student learning using a formative assessment journey. J Anat. 2014;224(3):296-303. doi:10.1111/joa.12117
10. Field A. Discovering Statistics Using SPSS. SAGE Publications; 2009. https://play.google.com/store/books/details?id=4mEOw7xa3z8C
11. Haist SA, Butler AP, Paniagua MA. Testing and evaluation: the present and future of the assessment of medical professionals. Adv Physiol Educ. 2017;41(1):149-153. doi:10.1152/advan.00001.2017
12. Joanes DN, Gill CA. Comparing measures of sample skewness and kurtosis. J Royal Statistical Soc D. 1998;47(1):183-189. doi:10.1111/1467-9884.00122
13. Lord FM. The relation of the reliability of multiple-choice tests to the distribution of item difficulties. Psychometrika. 1952;17(2):181-194. doi:10.1007/BF02288781
14. Matlock-Hetzel S. Basic Concepts in Item and Test Analysis. Presented at: The Annual Meeting of the Southwest Educational Research Association; January 23-25 1997; Austin, TX. Accessed January 11, 2022. https://eric.ed.gov/?id=ED406441
15. Oosterhof A. Classroom Applications of Educational Measurement. Third Edition. Prentice-Hall, Inc.; 2001.
16. Oosterhof A. Developing and Using Classroom Assessments. Fourth Edition. Pearson; 2009.
17. Prashanti E, Ramnarayan K. Ten maxims of formative assessment. Adv Physiol Educ. 2019;43(2):99-102. doi:10.1152/advan.00173.2018
18. Razali NM, Wah YB, Others. Power comparisons of shapiro-wilk, kolmogorov-smirnov, lilliefors and anderson-darling tests. Journal of statistical modeling and analytics. 2011;2(1):21-33. https://www.nbi.dk/~petersen/Teaching/Stat2017/Power_Comparisons_of_Shapiro-Wilk_Kolmogorov-Smirn.pdf
19. Rolfe I, McPherson J. Formative assessment: how am I doing? Lancet. 1995;345(8953):837-839. https://www.sciencedirect.com/science/article/pii/S0140673695929681
20. Understanding item analyses. Office of Educational Assessment. Accessed January 11, 2022. https://www.washington.edu/assessment/scanning-scoring/scoring/reports/item-analysis/
21. Vanderbilt AA, Feldman M, Wood IK. Assessment in undergraduate medical education: a review of course exams. Med Educ Online. 2013;18:1-5.doi:10.3402/meo.v18i0.20438
22. Wickham H, Averick M, Bryan J, et al. Welcome to the tidyverse. J Open Source Softw. 2019;4(43):1686. doi:10.21105/joss.01686
23. Wood DA, Adkins DC. Test Construction: Development and Interpretation of Achievement Tests. CE Merrill Books; 1960.
24. Yap BW, Sim CH. Comparisons of various types of normality tests. J Stat Comput Simul. 2011;81(12):2141-2155. doi:10.1080/00949655.2010.520163