Understanding The Level Of BMI, Diet, And Physical Activity in Ats, Specifically Between Genders
Emily Madrak, PhD, ATC (corresponding author), Assistant Professor.
Department of Kinesiology., 322 SHWC, 550 Brandon Ave, University of Virginia, Charlottesville, VA 22903, 570 877-22278 (cell), 434-924-6187 (office)
Cvy5fx@virginia.edu
Ki L Cole, PhD, Associate Professor, Research, Education, Measurement and Statistics
Oklahoma State University, Ki.cole@okstate.edu
Bridget M Miller, PhD, Associate Dean for Undergraduate Affairs, Clinical Associate Professor, Arnold School of Public Health, University of South Carolina, Bridget miller@sc.edu
Jennifer L Volberding, PhD, ATC, Department Chair,Professor, Program Director
Department of Athletic Training, Oklahoma State University, Center for Health Sciences
Tulsa, OK, Jennifer.volberding@okstate.edu
We know that patient-centered care and customizing health care are crucial for acknowledging unique physiological and psychological differences, especially by gender.1–3 Athletic trainers (ATs) have foundational knowledge and follow evidence-based practice guidelines on achieving these measures personally and with their patients.4 Though there is considerable medical research and journals on patient outcomes, there is less research regarding healthcare provider outcomes, especially ATs by gender.
When considering health and well-being [in general], gender plays a strong role, as it can impact disease burden, self-perception of health, and self-efficacy in health behaviors.5 It is also important to understand that sex and gender are different constructs, but both need to be taken into consideration when treating patients, as sex will inform biological processes and gender will inform sociodemographic and environmental concepts (such as referral, treatment guidelines, bias, and discrimination).6 There is a long history of gender bias in healthcare, but we are slowly making changes for the better.7 By understanding the differences sex and gender have on health, ATs can better advocate for themselves to ensure they receive optimal support and resources for their well-being and professional growth.2,8
Healthcare providers, in general, are at higher risk for poor health outcomes due to high stress, long working hours, and inflexible schedules.8 Similarly, research suggests the profession of athletic training may be considered time-poor.9–11 A profession is considered time-poor when providers have minimal discretionary time, irregular working hours, and may invest more time in patient care than themselves, which can contribute to inconsistent health behaviors.9–11 In terms of gender, women may feel the brunt of time-poorness more than men, especially mothers.11 Women often take on what is called the “second shift,” which is the unpaid work, such as household duties and caring for children, once they return home from their job.11,12 This can lead to fewer time and energy resources.11,12 Along with providing safe care for patients, ATs must prioritize their well-being for the betterment of their health status 8,12 Though optimizing health and wellness is important, there is little research regarding ATs' health behaviors, and even less distinguishing by gender.
When optimizing well-being and health, measures such as physical activity, diet, and BMI may prove to be useful. The US Department of Health and Human Services (USDHHS) recommends 150 to 300 minutes moderate-intensity aerobic PA per week, or 75-150 minutes vigorous-intensity aerobic PA per week, to support a healthy lifestyle and lower obesity risk.13 For diet, the USDHHS recommends following a healthy eating plan across the lifespan, shifting to healthier, nutrient-dense foods and beverages for improving health and lowering obesity risk.14 Ideally, following the guidelines for PA and diet will assist in achieving optimal well-being and health, which can help in keeping BMI at a normal level.13–16
For gender and BMI, gender-related behavioral factors suggest that men’s higher BMI is partly due to their lack of negative views toward obesity that women often have.17 The Centers for Disease Control and Prevention states 24.2% of US adults meet physical activity guidelines, with men (28.3%) scoring higher than women (20.4%).18 Furthermore, the CDC reports approximately 67.3% of adults 20 or older consumed fruit on any given day, with women (70.5%) being higher than men (63.8%).19 Similar is observed with observed with vegetables, where 95.1% of American consumed them on any given day, with women (95.3%) being slightly higher than men (95.0%).19 Therefore, our study seeks to understand the level of BMI, diet, and physical activity in ATs, specifically between genders. We hypothesize that cisgender men ATs will demonstrate a greater BMI than cisgender women and other genders. Additionally, we expect cisgender women to have healthier diet patterns compared to men and other genders, and the opposite for levels of PA.
METHODS
Participants
We recruited 2500 National Athletic Trainers’ Association (NATA) members in the United States for this study. Inclusion criteria required participants to be “normally functioning” NATA members with active “ATC” credentials. Normally functioning is operationally defined by the researchers as: “having optimal health status, either free of conditions that significantly alter health status or a condition in which dietary patterns, physical activity, workability, and weight are stably controlled.” This specific inclusion criterion was required as we aimed to create a baseline for optimal health for this study. Frequently, certain conditions can cause alterations in one’s diet, physical activity, and body mass, such a diabetes, Crohn’s disease, certain cancers, pregnancy, etc.
Tasks
A cross-sectional quantitative survey was conducted using the NATA research service center to distribute it via email. An institutional review board (IRB-20-288) approved this research, and participation was voluntary.
Procedures
A pilot study was conducted before the main research to better assess reliability, validity, and comprehension. Once the data was analyzed and reviewed by a panel of experts, adjustments were made to the main study. This study was distributed through the NATA research survey service. It sent out 4 email reminders to the selected 2500 participants, spaced 2 weeks apart.
Instruments
The present study featured 60 questions as part of a larger project. In addition to the 3 instruments described below used in the current study, a demographics section was added that asked age, gender, years certified, average amount of hours worked per week, work setting, region of residence, and average annual income.
Obesity Status - BMI
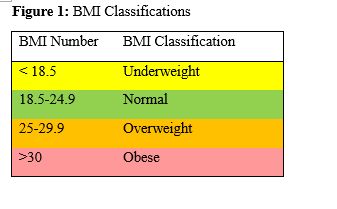
Obesity status is determined through the Body Mass Index (BMI), which is a measure of height and weight that is then classified based on a calculation of each.20
(body weight, kilograms) / (body height, meters2)
It is the most common and easiest objective form of measurement for determining obesity levels in large populations (Figure 1).21,22 Although BMI is inexpensive and objective, it has been considered a poor indicator of body fat due to its lack of differentiation between body fat and muscle.23 Though the measure may have low efficacy, it is more feasible for large sample size and finances. Participants provided height and weight, which was calculated and classified by underweight, normal, overweight, or obese. The test-retest stability indicates α=0.995 and κ=0.895.24
Diet Patterns and Nutrition
We based the first portion of our survey on The KomPAN is a food frequency questionnaire that assesses dietary habits, food frequency consumption, nutrition beliefs, lifestyle, and personal data.25 The original survey contains four sections: dietary habits, frequency of food consumption, nutrition beliefs, lifestyle, and personal data.25 We used 3 original items from the KomPAN, modified 5, created 5, and omitted 21 additional questions for a total of 13 questions omitted to better fit our study, as the original instrument is European and features foods that were not similar to those listed in the Dietary Guidelines for Americans.14 (Permission was granted from the authors, pending new pilot study and reliability analysis). The foods were categorized into healthy and unhealthy eating. The index with the greater score indicates the intensity of the characteristics of diet.25 The pilot study was used to ascertain the reliability of this new scale, comprehension by the readers, and face validity. After completing a reliability analysis from the pilot data, the new scale demonstrated α=0.71. Comprehension was determined by comments from pilot study participants and face validity was evaluated by a panel of experts.
Physical Activity
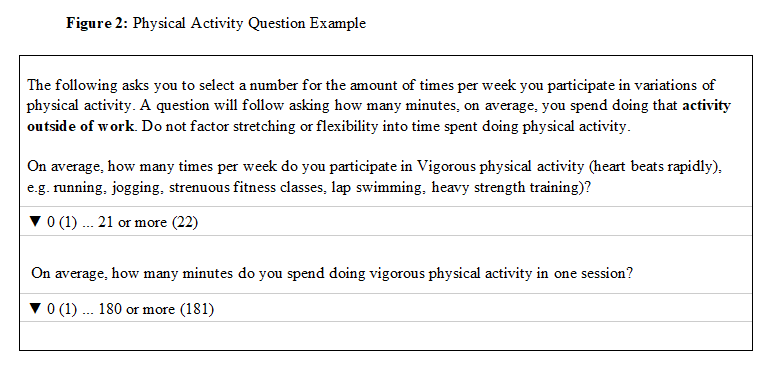
Physical Activity was assessed through a series of questions based on the 2018 PA guidelines by the USDHHS.13 This survey asked how many times per week (from 0 to 21 or more) the individual participates in PA in terms of vigorous, moderate, or light. It then asked the average amount of minutes spent doing that intensity of activity, ranging from 0-180 or more, with an example displayed in Figure 2. To evaluate face validity, a pilot survey and a panel of experts reviewed questions.
Statistical Analysis
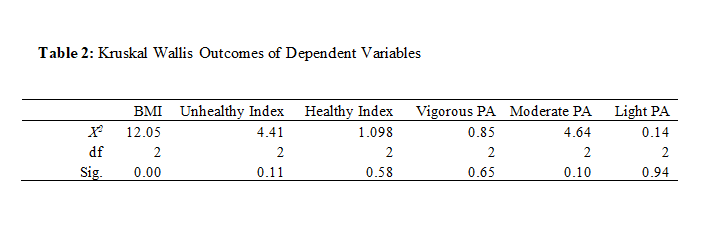
To meet a medium effect size (Cohen’s d=0.5) with 95% power at a 5% significance level, we estimated the required sample size to be 210. This was analyzed using G*Power 3.1.9.7. Due to unequal sample sizes, we used 6 Kruskal-Wallis tests to compare the independent variable, gender, to the dependent variables BMI(1), PA(3), and healthy eating(2). Data was analyzed with SPSS (version 24.0, IMB Corp, Armonk, NY).
RESULTS
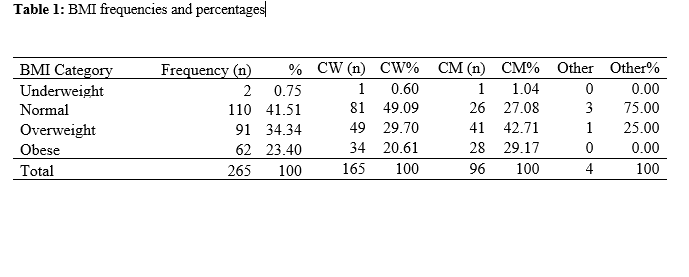
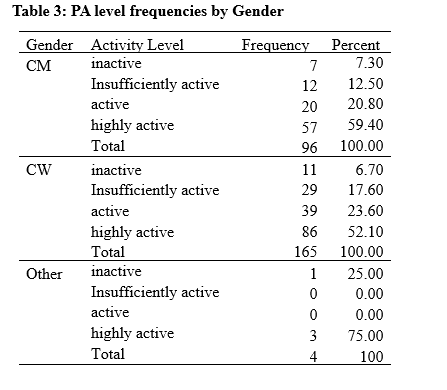
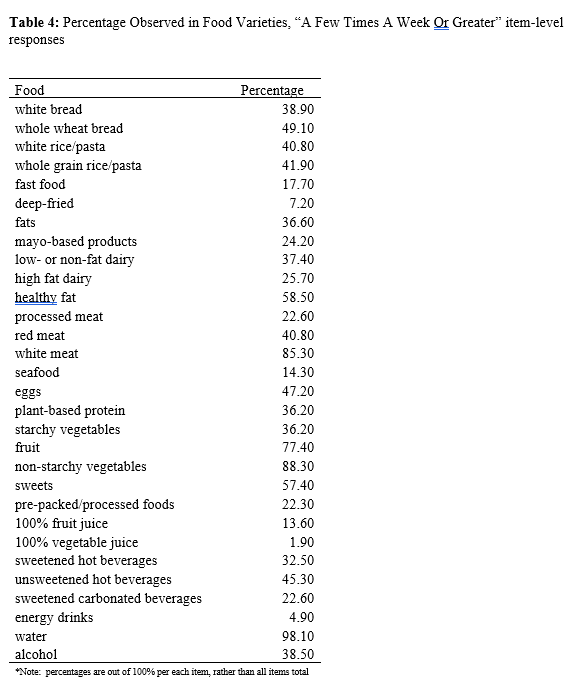
Of 379 participants who accessed the survey, 265 successfully met inclusion criteria and completed the survey, achieving a confidence interval of 91.4% confidence interval with a ± 5% margin of error. The number of items in the survey likely contributed to fatigue and a lower than recommended confidence interval, which may impact the generalizability of the findings. The effect of gender on BMI, x2(3) = 12.06, p = 0.002; demonstrated that cisgender men (CM) (n=96) were more likely to have a greater BMI than cisgender women (CW) (n= 165), p<0.03, with M=27.13, combined (overweight). Results of BMI categories (n=265) are included in table 1. Though PA, healthy, and unhealthy eating did not produce significant results in table 2, they did provide useful information. Most ATs met the USDHHS PA guidelines (77%), table 3.13 In comparison of the eating indexes, the healthy index (M=33.54) demonstrated a low intensity (<34), while the unhealthy index (M=36.96) demonstrated a medium intensity (34-66). Descriptive diet data (table 4) exhibits food choices.
DISCUSSION
The purpose of this research was to observe certain markers of health behaviors, BMI, diet, and physical activity between genders in ATs to have a greater understanding of health AT health disparities by gender. Though only BMI and gender were significant, we did find positive findings with diet and physical activity.
BMI and Gender
Our findings suggest that BMI differed by gender, with CM reporting higher BMI than CW, which supports our hypothesis. Almost half of CW were normal BMI while only 27% of CM were normal BMI, agreeing with most gender and BMI research.26,27 Aligning with gender’s sociological context, evidence points toward psychosocial and biological inferences. The statistic of men having a greater BMI than women may have been influenced by stereotypes in such as men having a well-built and muscular physique.3 This stereotype may be the driving force for the desire to be heavier.3 Most research suggests that psychosocial reasoning for greater BMI in men is that they lack the negative views that women have toward obesity.17 Due to the negative view women have, they will spend more time, effort, and money on becoming or staying thin while also causing preoccupations with weight, negative mood, and body dissatisfaction.17 These ideals are related to Western industrialization and an increase in popular culture, which inflates beauty culture and the need to be thin.28 Though our data does not indicate differences between muscle in fat in BMI, we can still provide evidence of how BMI of “overweight” can impact healthcare providers. In general healthcare populations, research suggests stigmatization from patient to provider may occur when the provider is overweight, where the patient may evaluate the provider more negatively, have lower trust, less likely to follow advice, and/or change providers to one who is of lower weight.29 This may increase the workload on the provider, where they may need to overcompensate with patient education, resources, and treatment plans, leading to more stress.29 If this is occurring in general populations, the likelihood that it occurs within populations that ATs treat is high, especially considering the pervasive stigma of being overweight when being in or working with physically active populations.30
Impact on Health
We know that BMI is not the greatest indicator of overweight or obesity, but for large samples, it serves to be the most efficacious tool. In addition to psychosocial inferences, biological characteristics of CM, or males, suggest that men are likely to have a greater lean muscle mass, while CW, or females will have a higher percentage of body fat.31 With muscle having a greater density than fat by volume, this may explain why BMI may be greater in men.31 Despite this, fat distribution in men (greater accumulation in the abdomen) is associated with higher cardiometabolic risk factors than in women.31 These can include common conditions such as obesity, hypertension, type 2 diabetes, and high cholesterol.32 This can also have an effect on work ability and productivity, where overweight and obese individuals may have greater rates of absenteeism from work due to the potential comorbidities associated with this.33 Researchers established that obese individuals can incur a 5% loss in productivity level due to needing extra time to complete tasks that are physically demanding.34
Diet & Physical Activity
Significant results were not observed in eating patterns by gender.27 Research suggests women have a greater affinity for healthy eating to retain a thin physique, while men likely gravitate toward unhealthy eating due to preferences in meat and alcohol.28,35 Though the eating patterns were not significant, it was important to indicate the descriptive information from the dietary habit and food frequency items in the survey. The information gave valuable insight into the eating habits in ATs and potential starting points for where mitigation can occur for a healthier lifestyle. As a result of the significant BMI differences in gender and descriptive information for diet, future research should investigate specific variables that relate to BMI, such as nutrition and psychosocial issues.
In addition to diet, PA did not produce significant results. Despite this, 77% met the USDHHS's recommended guidelines for PA. This result was more than triple the outcome of the US adult statistic, suggesting ATs make PA a priority within their health behaviors.18 This may be attributed to the well-known positive effects that PA may bring.13 Additionally, PA is said to have a protective effect against stress, especially for women ATs.36 Even with considerable time commitments and time poorness, research indicates that working long hours does not affect PA.37
Implications & Interventions
Interventions such as mental health therapy, exercise, and following a healthy eating plan appear to be obvious choices, especially considering the knowledge ATs have in optimizing wellness. However, research in healthcare workers suggests that due to their often unconventional schedules, finding stress relief and therapy services has proven to be difficult for healthcare workers, making it difficult to obtain timely and effective support.38 In addition to a lack of support, this can also affect adherence to goals and routines, making a balanced diet and regular exercise difficult.38 Guo et al. suggest rotational rest, psychological support promptly, healthy lifestyle guidance, and modification of unhealthy behaviors to address the problems related to overweight and obesity in healthcare workers.38 In athletic training, this may look more like shift work, implementing the “medical model” of care rather than a schedule dictated by a sport’s “go” times.39 The medical model has demonstrated benefits of better work-life balance and role congruency for the AT and can create better alignment for patient care as a result.39 Additionally, Eason et al. suggest that support from a supervisor is key in creating a healthier environment, whether that is with a medical model in a more traditional setting like college/university or having appropriate measures in place for clinic and non-traditional settings.39 In terms of gender, though a societal foothold may be difficult to change, systems within the workplace can be implemented to understand the burden that each gender faces, such as role strain and autonomy for men and disproportionate labor duties and greater burnout rates for women, can be the beginning stages of addressing a healthier workplace.9,11,39,40
Limitations
Self-report measures are convenient, but not always honest, especially regarding weight. The questionnaire featured over 60 questions which can cause fatigue or early drop-out. Though BMI was convenient, it does not consider fat versus muscle volume. The inclusion criteria could be considered subjective, which could have impacted consistency. Finally, this research was conducted during the COVID-19 outbreak, which could have altered lifestyles.
Future Research
In terms of future research, replicating this study with participants having any type of condition (including “normally functioning”) would provide a greater diversity pool. Using wearable activity trackers and more accurate assessments of body mass may produce more robust results. Using a more reliable tool such as DEXA, hydrostatic weighing, and/or even bioelectrical impedance should be considered for future studies. Using participant incentives may assist in recruiting larger numbers. Additionally, observing the patient’s perspective how their ATs health behaviors may affect their outcomes would be an advantageous next step study.
Conclusion
The results of this study were similar to previous research, however, they open up larger areas of inquiry to follow up in future studies. With gender and BMI, it was discovered that men are more likely to have a greater BMI. Additionally, although diet and PA did not produce significant results, they did provide great info that ATs are exceeding the national average for PA. These results could be useful for bringing awareness of cultural demands that influence health behaviors for men and women ATs. Additionally, this research could be useful for increasing worksite health promotion in athletic trainers and motivation for improved self-care.
REFERENCES
1. Salles A, Awad M, Goldin L, et al. Estimating Implicit and Explicit Gender Bias Among Health Care Professionals and Surgeons. JAMA Network Open. 2019;2(7):e196545. doi:10.1001/jamanetworkopen.2019.6545
2. Minvielle E, Fourcade A, Ricketts T, Waelli M. Current developments in delivering customized care: a scoping review. BMC Health Services Research. 2021;21(1):575. doi:10.1186/s12913-021-06576-0
3. Kuan PX, Ho HL, Shuhaili MS, Siti AA, Gudum HR. Gender differences in body mass index, body weight perception and weight loss strategies among undergraduates in Universiti Malaysia Sarawak. Malays J Nutr. 2011;17(1):67-75.
4. BOC - Athletic Trainers. Accessed April 24, 2023. https://bocatc.org/athletic-trainers/practice-analysis
5. Sood R, Jenkins SM, Sood A, Clark MM. Gender Differences in Self-perception of Health at a Wellness Center. Am J Health Behav. 2019;43(6):1129-1135. doi:10.5993/AJHB.43.6.10
6. Regitz-Zagrosek V. Sex and gender differences in health. EMBO Rep. 2012;13(7):596-603. doi:10.1038/embor.2012.87
7. Hamberg K. Gender Bias in Medicine. Womens Health (Lond Engl). 2008;4(3):237-243. doi:10.2217/17455057.4.3.237
8. Holtzclaw L, Arlinghaus KR, Johnston CA. The Health of Health Care Professionals. Am J Lifestyle Med. 2020;15(2):130-132. doi:10.1177/1559827620977065
9. Mazerolle SM, Bruening JE, Casa DJ. Work-Family Conflict, Part I: Antecedents of Work-Family Conflict in National Collegiate Athletic Association Division I-A Certified Athletic Trainers. Journal of Athletic Training. 2008;43(5):505-512. doi:10.4085/1062-6050-43.5.505
10. Fiese BH. Time allocation and dietary habits in the United States: Time for re-evaluation? Physiology & Behavior. 2018;193:205-208. doi:10.1016/j.physbeh.2018.02.040
11. Kahanov L, Loebsack AR, Masucci MA, Roberts J. Perspectives on Parenthood and Working of Female Athletic Trainers in the Secondary School and Collegiate Settings. Accessed July 17, 2024. https://dx.doi.org/10.4085/1062-6050-45.5.459
12. Dugan AG, Barnes-Farrell JL. Working mothers’ second shift, personal resources, and self-care. Community, Work & Family. 2020;23(1):62-79. doi:10.1080/13668803.2018.1449732
13. Physical Activity Guidelines for Americans, 2nd edition. Published online 2018.
14. 2015-2020 Dietary Guidelines for Americans.
15. Kyle RG, Wills J, Mahoney C, Hoyle L, Kelly M, Atherton IM. Obesity prevalence among healthcare professionals in England: a cross-sectional study using the Health Survey for England. BMJ Open. 2017;7(12):e018498. doi:10.1136/bmjopen-2017-018498
16. Management I of M (US) S on MW. Military Standards for Fitness, Weight, and Body Composition. National Academies Press (US); 2004. Accessed April 24, 2023. https://www.ncbi.nlm.nih.gov/books/NBK221832/
17. Manios Y, Panagiotakos DB, Pitsavos C, Polychronopoulos E, Stefanadis C. Implication of socio-economic status on the prevalence of overweight and obesity in Greek adults: the ATTICA study. Health Policy. 2005;74(2):224-232. doi:10.1016/j.healthpol.2005.01.014
18. Physical Activity Among Adults Aged 18 and Over: United States, 2020. doi:10.15620/cdc:120213
19. Fruit and Vegetable Consumption Among Adults in the United States, 2015–2018. doi:10.15620/cdc:100470
20. Eknoyan G. Adolphe Quetelet (1796 1874) the average man and indices of obesity. Nephrology Dialysis Transplantation. 2007;23(1):47-51. doi:10.1093/ndt/gfm517
21. Body mass index (BMI). Accessed April 24, 2023. https://www.who.int/data/gho/data/themes/topics/topic-details/GHO/body-mass-index
22. Obesity and overweight. Accessed April 24, 2023. https://www.who.int/news-room/fact-sheets/detail/obesity-and-overweight
23. Nuttall FQ. Body Mass Index: Obesity, BMI, and Health A Critical Review. Nutrition Today. 2015;50(3):117-128. doi:10.1097/NT.0000000000000092
24. Hart PD. Test-Retest Stability of Four Common Body Composition Assessments in College Students. JPFMTS. 2017;1(3). doi:10.19080/JPFMTS.2017.01.555561
25. Jeżewska-Zychowicz M, Gawęcki J, Wadolowska L, et al. Dietary Habits and Nutrition Beliefs Questionnaire and the Manual for Developing of Nutritional Data.; 2018.
26. Sharma SK, Mudgal SK, Thakur K, Gaur R, Aggarwal P. Lifestyle behavior of budding health care professionals: A cross-sectional descriptive study. J Family Med Prim Care. 2020;9(7):3525-3531. doi:10.4103/jfmpc.jfmpc_491_20
27. Torres-McGehee TM, Emerson DM, Moore EM, et al. Examination of Energy Balance, Eating Disorder Risk, and Pathogenic Behaviors among Athletic Trainers. J Athl Train. Published online November 5, 2020. doi:10.4085/228-20
28. Keel PK, Forney KJ. Psychosocial risk factors for eating disorders. Int J Eat Disord. 2013;46(5):433-439. doi:10.1002/eat.22094
29. Puhl RM, Gold JA, Luedicke J, DePierre JA. The effect of physicians’ body weight on patient attitudes: implications for physician selection, trust and adherence to medical advice. Int J Obes. 2013;37(11):1415-1421. doi:10.1038/ijo.2013.33
30. Thedinga HK, Zehl R, Thiel A. Weight stigma experiences and self-exclusion from sport and exercise settings among people with obesity. BMC Public Health. 2021;21(1):565. doi:10.1186/s12889-021-10565-7
31. Schorr M, Dichtel LE, Gerweck AV, et al. Sex differences in body composition and association with cardiometabolic risk. Biology of Sex Differences. 2018;9(1):28. doi:10.1186/s13293-018-0189-3
32. Cardiometabolic Risk - an overview | ScienceDirect Topics. Accessed March 11, 2025. https://www-sciencedirect-com.proxy1.library.virginia.edu/topics/medicine-and-dentistry/cardiometabolic-risk
33. Kudel I, Huang JC, Ganguly R. Impact of Obesity on Work Productivity in Different US Occupations: Analysis of the National Health and Wellness Survey 2014 to 2015. J Occup Environ Med. 2018;60(1):6-11. doi:10.1097/JOM.0000000000001144
34. Gates DM, Succop P, Brehm BJ, Gillespie GL, Sommers BD. Obesity and Presenteeism: The Impact of Body Mass Index on Workplace Productivity. Journal of Occupational and Environmental Medicine. 2008;50(1):39. doi:10.1097/JOM.0b013e31815d8db2
35. Arganini C, Saba A, Comitato R, et al. Gender Differences in Food Choice and Dietary Intake in Modern Western Societies. IntechOpen; 2012. doi:10.5772/37886
36. Groth JJ, Ayers SF, Miller MG, Arbogast WD. Self-Reported Health and Fitness Habits of Certified Athletic Trainers. J Athl Train. 2008;43(6):617-623.
37. Angrave D, Charlwood A, Wooden M. Long working hours and physical activity. J Epidemiol Community Health. 2015;69(8):738-744. doi:10.1136/jech-2014-205230
38. Guo X, Gong S, Chen Y, et al. Lifestyle behaviors and stress are risk factors for overweight and obesity in healthcare workers: a cross-sectional survey. BMC Public Health. 2023;23(1):1791. doi:10.1186/s12889-023-16673-w
39. Eason CM, Mazerolle SM, Goodman A. Organizational Infrastructure in the Collegiate Athletic Training Setting, Part III: Benefits of and Barriers in the Medical and Academic Models. J Athl Train. 2017;52(1):35-44. doi:10.4085/1062-6050-51.12.25
40. Goodman A, Mazerolle SM, Pitney WA. Achieving Work-Life Balance in the National Collegiate Athletic Association Division I Setting, Part II: Perspectives From Head Athletic Trainers. J Athl Train. 2015;50(1):89-94. doi:10.4085/1062-6050-49.3.87