Alexander J. Rouch, Ph.D., Chair, Pharmacology and Physiology, OSU Center for Health Sciences
Joseph B. Meter, B.S., Medical Student, OSU Center for Health Sciences
Liming Fan, M.S., Senior Research Assistant, OSU Center for Health Sciences
Introduction: Consuming high levels of salt and fructose leads to hypertension and obesity in males and females, but comparatively, the latter appear to be protected against dietary-induced pathologies. The purpose of this study was to determine the effects of 17-estradiol (E2) on blood pressure and renal sodium excretion in mice consuming a diet of high salt and high fructose. Previous studies suggest that E2 administration via a 1.5 mg E2 pellet and a 0.05 mg E2 pellet in mice provide either too much or too little E2, respectively. This pilot study was designed to analyze the effects induced by a 0.7 mg E2 pellet.
Methods: Ovariectomized CD-1 mice were placed in metabolic cages for 17 days while consuming 4% salt chow with a fluid containing 1% NaCl and 20% fructose. Daily measurements included body weight, food and fluid intake, urine volume, and renal sodium excretion (Nae). Sodium intake (Nai) was determined from food and fluid intake and Nae was calculated by multiplying urine flow rate by urine [Na+]. Molecular expression of renal markers for sodium transport was measured via real-time PCR. Blood pressure was measured via the tail-cuff technique. Mice were divided into two groups: placebo (P) and E2 (n=5/group). No treatment was performed for the first four days of the study, i.e., baseline period. On the fifth day, pellets (placebo or 0.7 mg E2) were implanted subcutaneously for the remainder of the study (i.e., E2 period).
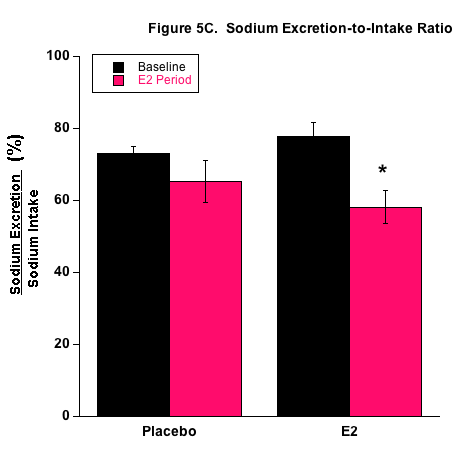
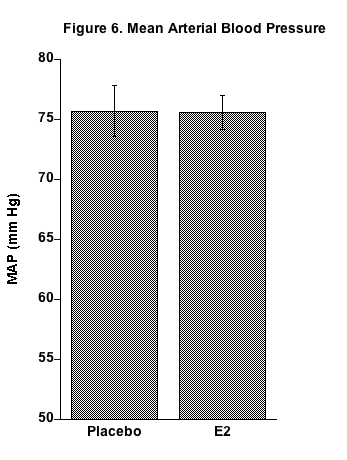
Results: Blood pressure was not different between P and E2 mice. Body weight was not different at the beginning but decreased in both groups with the P group having higher body weight at the end of the study (p less than 0.01). The P group consumed more fluid (p less than 0.0005) and excreted more urine (p less than 0.01) than the E2 group in the E2 period. Average Nae/Nai ratio during the E2 period was lower in the E2 group (p less than 0.03). The E2 group had higher mRNA expression of renal cortical NKCC2 (p less than 0.01) and ENaC (p less than 0.005) sodium-transport markers.
Conclusion: The 0.7 mg E2 pellet induced significant effects on fluid intake, urine output, and renal sodium handling, with no observed pathologies. The 0.7 mg pellet appears to provide an effective method of administering E2 in mice for future longer-term studies investigating the many yet-to-be discovered effects of E2 on physiological function.
Hypertension, metabolic syndrome, diabetes, and obesity present major health problems to society and great challenges to the clinical profession. A recent CDC report obtained from a Google search (“Prevalence of diabetes and hypertension”) indicates that over 30 million people or 9.4% of the U.S. population have diabetes and about one-third of the population is hypertensive. Studies on the demographics and estimated costs illustrate the severity of diabetes and hypertension.1-3 While it is encouraging that these diseases may have plateaued in recent years, the impact on society related to the well-being of the population and the enormous financial costs demonstrate the need for further research in all areas of understanding including the clinical, biological, pathological, and psychological. Both genetic and environmental factors play important causative roles in these diseases, and it is well known that dietary practices and preferences provide major contributions.
While fructose is a naturally occurring form of sugar in fruits and vegetables, the advent of high fructose corn syrup in the late 1970s has made it much more accessible to Americans.4 This monosaccharide is found in sweetened beverages as well as processed foods that are consumed on a regular basis. As a result, fructose consumption has drastically increased with one study estimating a 32% increase between 1977 and 2004.5 In addition to a diet high in fructose, the amount of salt in the American diet is elevated as well. While the recommended daily intake for sodium is 2300 mg/day, Nutritional and Health Examination Survey Data obtained between 2005 and 2006 demonstrated that 20-29-year-old males consume close to double the recommended daily value while females consume 135% of that amount.6 A recent study demonstrated that elevated fructose consumption may stimulate the renal reabsorption of sodium, thereby leading to elevated blood pressure. 7
The kidneys carry out the important physiologic processes governing salt and water homeostasis8. The importance of regulating salt becomes readily apparent when one considers that excess salt in the plasma creates an osmotic effect pulling water into the blood stream causing elevated blood volume with a subsequent increase in cardiac output resulting in high blood pressure.9 Essentially, as dietary fructose increases above normal levels, the kidneys reabsorb more fructose and salt leading to a subsequent and sustained increase in total body sodium and thus, increased risk for salt-induced hypertension.10,11
Several studies have identified sex differences with regard to blood pressure. 12-14 In the general population, hypertension is more prevalent among males than females. 15 Sex differences have also been observed in the metabolism and transport of salt, water, and organic ions as well as in hormonal regulation pathways, in particular, the renin-angiotensin-aldosterone system. 16 Considering this information, it is plausible that one might find sex differences in metabolism and renal handling of fructose and salt. Interestingly, such differences have been demonstrated in both humans and animals, with most studies showing that males are more sensitive to a high fructose diet as evidenced by increased resistance to insulin, de novo triacylglyceride synthesis, and blood pressure.17
Considering this information, our lab has been conducting studies to determine the effects of 17-estradiol (E2) on blood pressure and the renal handling of sodium in mice consuming a high salt and high fructose (HSHF) diet. Pellets are used to administer the hormone and one particular challenge has been determining the specific pellet size to deliver optimal E2 levels. Previous studies have used the 1.5 mg and 0.05 mg E2 pellets with the former inducing pathological effects to the lower urinary tract and the latter appearing not to be effective at producing any expected results. In this study our specific objective was to repeat previous protocols via the same methods, albeit for a shorter time frame, using a 0.7 mg E2 pellet. Based on our previous results, the working hypothesis has been that E2 administration increases renal sodium reabsorption under HSHF consumption. As such, the purpose of this study was to evaluate the effects of E2 administration, via the 0.7 mg E2 pellet, on blood pressure, renal sodium handling, and mRNA expression of key renal markers for sodium transport in ovariectomized (OVX) mice.
Animals: CD-1 female mice were obtained from Envigo RMS, Inc. (Indianapolis, IN) and had ovaries removed at about 21 days of age by Envigo technicians. Mice arrived to OSU-CHS and were placed in plastic bins where they consumed ad libitum normal diet and water for about 12 weeks. Mice were four months old at the start of the study when they were placed in metabolic cages and began consuming the HSHF diet consisting of 4% salt diet (Teklad, TD 120254) with fluid containing 1% NaCl and 20% fructose. All mice appeared healthy with no observed abnormalities. The OSU-CHS IACUC approved all experimental procedures with animals.
Procedures: The study included two groups of OVX mice (n = 5/group): OVX – placebo and OVX supplemented with 17-estradiol via the 0.7 mg E2 pellet (P & E2, respectively). Pellets, both E2 and P, were obtained from Innovative Research of America (Sarasota, FL). Placebo pellets contain all components of the E2 pellet except the active hormone. One pellet was inserted subcutaneously above the right shoulder of each mouse under short-term, isoflurane-induced anesthesia, using a trocar needle. Pellets are 3 mm in diameter and 1 mm thick. Insertion takes only a few seconds with no observed discomfort when the mouse awakens.
Mice were placed in metabolic cages and consumed the HSHF diet for 17 days. On day five, pellets were implanted. The experimental protocol is thus divided into two periods: 1) baseline period for the first four days; and, 2) the experimental or E2 period from day 5 to 17. Daily measurements included body weight, food intake, and fluid intake. Fresh food was replaced daily and food intake in grams was determined by measuring the weight of the food container at the beginning and end of the 24-hour period and taking the difference. Likewise, fluid intake in mls was determined by weighing the drinking bottle at the beginning and end of the 24-hour period. Fresh fluid was replaced every-other-day. Daily urine samples were collected to determine urine flow rate (UFR) and Na+ concentration ([Na]u) measured via an Easylyte® Na/K analyzer. Sodium excretion rate (Nae) was determined as: Nae = [Na]u (mEq/L) x UFR (ml/day). Sodium intake (Nai) was calculated via the food + fluid intake.
Molecular Measurements: The relative expression of renal markers was measured via quantitative real-time PCR (qPCR). At the end of the study mice from the two groups (n=4/group) were anaesthetized via isoflurane and killed. Kidneys were removed, placed in ice-cold buffer solution, and immediately processed for RNA extraction. Sections of about 10 mg of renal cortical tissue were dissected and total RNA was extracted using the MELTTM Nucleotide Isolation Kit (Ambion, Austin, TX) followed by the synthesis of cDNA using the RT2 First-Strand cDNA kit (QIAGEN). Custom PCR arrays produced by SA Biosciences (QIAGEN) contained tested primers of the following 12 specific markers: 1) ENaCᾳ (Scnn1a); 2) ENaC (Scnn1b); 3) ENaCγ (Scnn1g); 4) NKCC (Slcl2a1); 5) NCC (Slc12a3); 6) NHE3 (Slc9a3); 7) NHE2 (S19a2); 8) NaPi2A (Slc34a1); 9) SGLT (Slc5a12); 10) ᾳNaK ATPase (Atp1a1); 11) ATR1 (Agtra1a); and 12) ATR2 (Agtr2).
An Opticon 2 (MJ Research) thermocycler and Sybr-green technology were used to determine the fold difference of the renal markers between P and E2 groups. The ΔΔCt method was used to calculate relative expression18. The PCR arrays also contained primers for the following reference genes: 1) beta actin (Act); 2) glyceraldehyde-3-phosphate dehydrogenase (Gapdh); 3) hypoxanthineguanine phosphoribosyl transferase (Hprt); 4) glucuronidase beta (Gusb); 5) heat shock protein 90 alpha (cytosolic) class B member (Hsp90ab1). Data from Gapdh, Act, and Hprt were consistent throughout the measurements and were thus averaged and used in the ΔΔCt method.
Blood Pressure: Mean arterial blood pressure (MAP) was measured on days 8 through 16 of the study. The tail-cuff technique was employed to measure MAP using the CODA device from Kent Scientific (Torrington, CT)19. Briefly, this technique is performed with the mouse in a restrainer where the tail is exposed and placed in an occlusion cuff. The application of air pressure occludes blood flow to the tail and the slow release of air pressure allows blood to flow back into the tail and blood pressure is determined with the CODA software. Basically, the tail-cuff technique measures blood pressure via sphygmomanometry. This non-invasive technique provides accurate blood pressure measurement and is widely used20-23. The CODA device operates in cycles. One cycle includes 15 individual measurements of blood pressure although not all measurements are noted as valid by the CODA program. In this study two cycles were performed and a minimum of ten valid measurements were averaged to determine the blood pressure of a mouse recorded for a given day. The primary concern of this technique is the stress level of the mouse in the restrainer. Two or three sessions of about 15 – 20 minutes/session in the restrainer adequately prepare a mouse for the technique. Mice in this study were give one or two sessions per day for three days prior to blood pressure recording.
Statistics: Data are shown as mean ± se. A one-way ANOVA (GraphPad, Prism6, Ca) with repeated measures was used to determine differences in body weight, food and fluid intake, sodium balance, sodium excretion, and Nae/Nai ratio. Student’s t-test was used to determine differences in blood pressure and relative gene expression between the 2 groups (n = 4/group). Fisher LSD was used to carry out multiple comparisons. A p value < 0.05 was considered statistically significant.
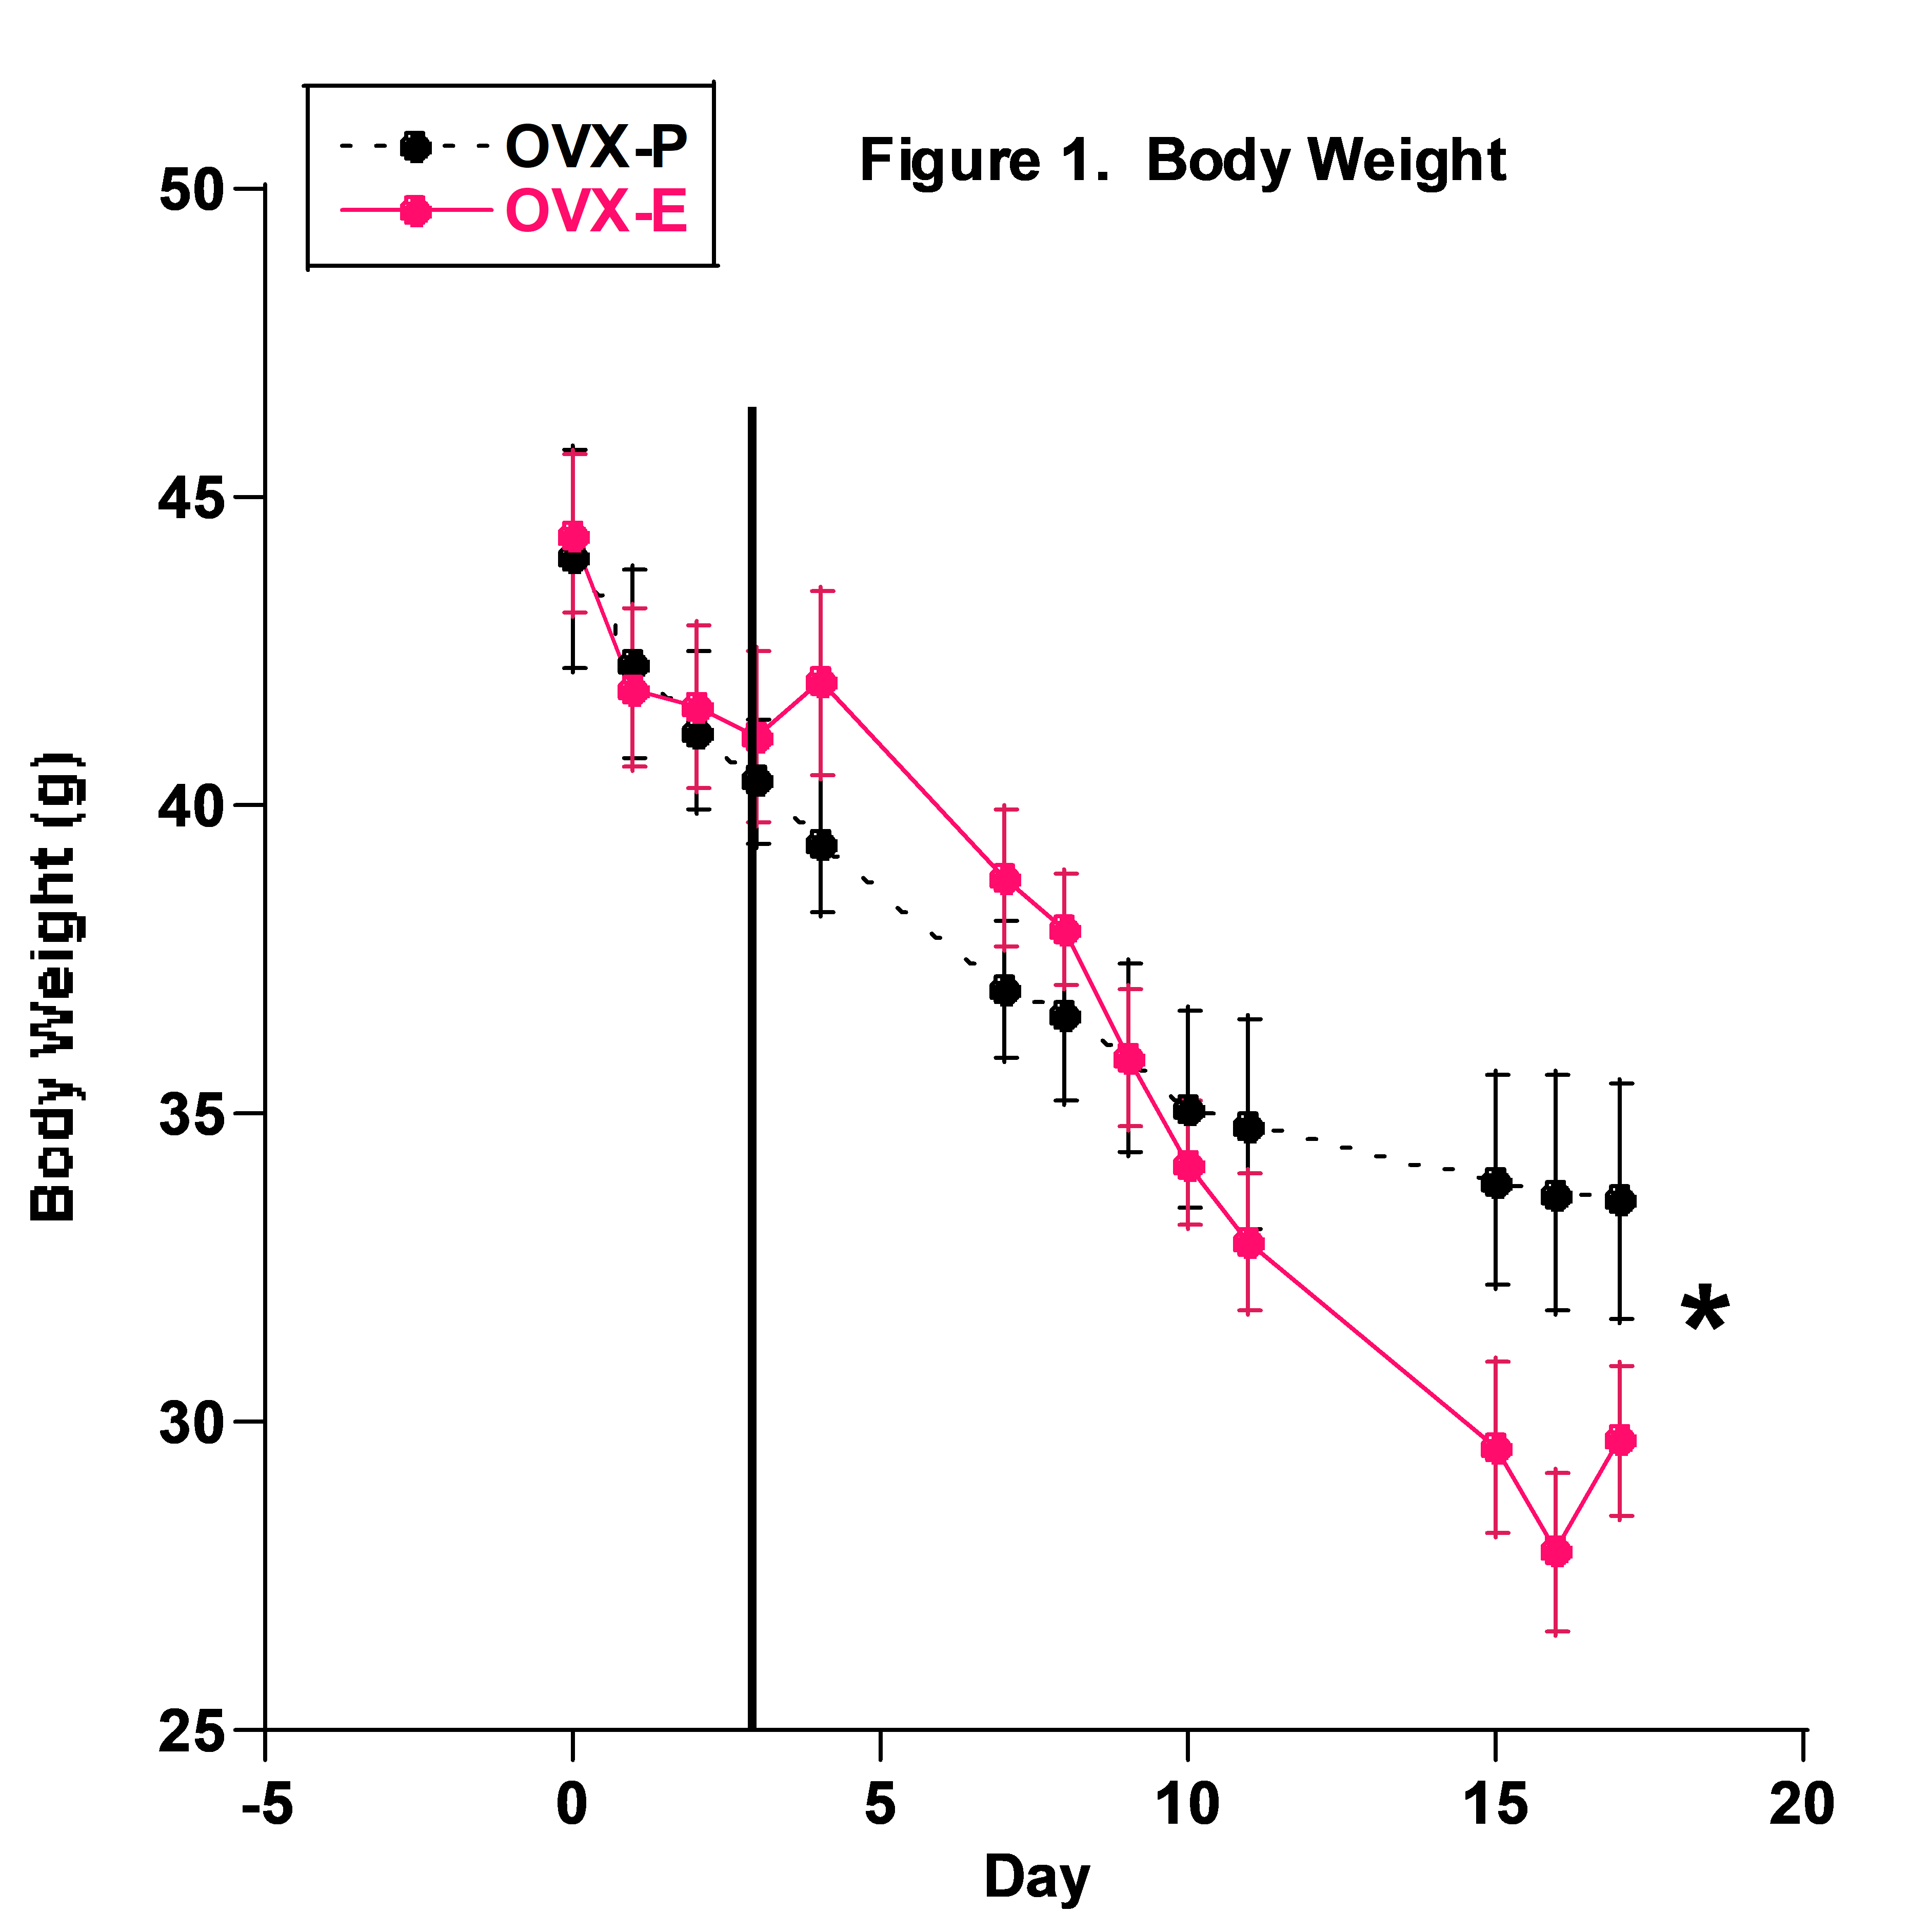
Body Weight: Body weight of both groups decreased significantly from the beginning to the end of the study (Fig. 1). By the end of the study, the P group had slightly though significantly higher body weight than the E2 group.

It is generally accepted that females are protected from the development of hypertension. 24 The argument for the presence of a protective mechanism is supported by the observation that premenopausal women have a lower prevalence of hypertension than post-menopausal women, as well as men of the same age. 25 This difference could be attributable to changes in levels of sex steroids, particularly E2.26 However, the effect of E2 on blood pressure continues to be controversial. At one time it was widely accepted that E2 administration would produce significant benefits for both women and men with hypertension and associated cardiovascular disease. However, results obtained from the Heart Estrogen Replacement Studies failed to confirm the belief and thus, stimulated extensive research in the field of sex-related steroids. 27,28
In addition to E2’s effects on sex characteristics and the development of the female reproductive system, E2 has important physiological effects on most organs and tissues in the body. Two main types of E2 receptors are ER- and ER- and both are present within endothelial cells and vascular smooth muscle including in and surrounding the kidneys. 29 Studies have shown that acute administration of E2 improves vasodilatory function and coronary blood flow, thereby lessening myocardial ischemia. 30 These observations demonstrate that E2 has vasoactive properties that may be responsible for the antihypertensive protection seen in females when compared with males of the same age. 25
We are currently investigating the effect of E2 on blood pressure and the renal handling of sodium in mice. An effective method for this project is to administer the hormone to OVX mice and compare results with an OVX-P group. Previous efforts in the lab have employed the use of 1.5 mg and 0.05 mg E2 pellets implanted subcutaneously to administer continuous and constant E2 levels throughout the experimental protocols. Results suggest that these dosages may not be optimal for the specific research objectives in that the 1.5 mg pellet appears to provide too much and the 0.05 mg pellet not enough. Hence, we decided to conduct this pilot project investigating the effects of E2 via a 0.7 mg pellet on blood pressure, renal sodium handling, and molecular expression of key renal markers of blood pressure and sodium transport in OVX mice consuming a HSHF diet. This dietary condition was chosen because previous results indicated a positive effect on elevating blood pressure in mice.31
In this paper we do not report actual E2 plasma levels from mice. Those measurements will be performed in the near future. However, previous measurements revealed significantly higher plasma E2 levels in the 1.5 mg pelleted OVX mice compared to intact female mice (approximately 30-40 pg/ml vs 10-20 pg/ml, respectively). Mice under the 1.5 mg pellet developed oliguria with overfilled bladders and obvious difficulty in voiding urine. They appeared bloated and lethargic. These mice also demonstrated the lowest sodium excretion values with lowest Nae/Nai ratios indicating significant sodium retention. It certainly appeared that under the HSHF condition, E2 acted on the kidney to increase sodium absorption. The net result of increased sodium retention could counteract any protective effect E2 would exert to prevent salt-induced hypertension. Unfortunately, the pathological effects observed complicate the interpretation of the results. Thus, to support our hypothesis that E2 causes sodium retention under high salt conditions, it is necessary to find the appropriate E2 pellet to use in future studies. Results of this pilot project appear promising in that significant effects on renal sodium handling were measured and no pathology in the E2-treated group was observed. A brief summary of the results is given below.
Body weight decreased with time (Fig. 1) and the decline in both groups basically paralleled each other. This was surprising since in previous studies body weight usually decreased only after the first day in metabolic cages and then either stabilized or increased. These previous studies used younger, 4-to-5 week-old, mice that had been in bins for about 5 – 8 days prior to going in metabolic cages. We think the difference in this study resulted from using mice that had been living in bins with other mice for 10-to-12 weeks before the study and probably required more time to become accustomed to the metabolic cages. Also, these mice were older and weighed significantly more than mice from our previous studies (40 – 50 grams vs 20 – 30 grams, respectively). Body weight appeared to level off, at least in the P group, in the final three days of the study and we suspect it would have stabilized or increased had the study continued. The observation that the P group’s body weight was slightly, though significantly higher during the final days is most likely explained by the higher fluid, and thus fructose, intake in the P group.
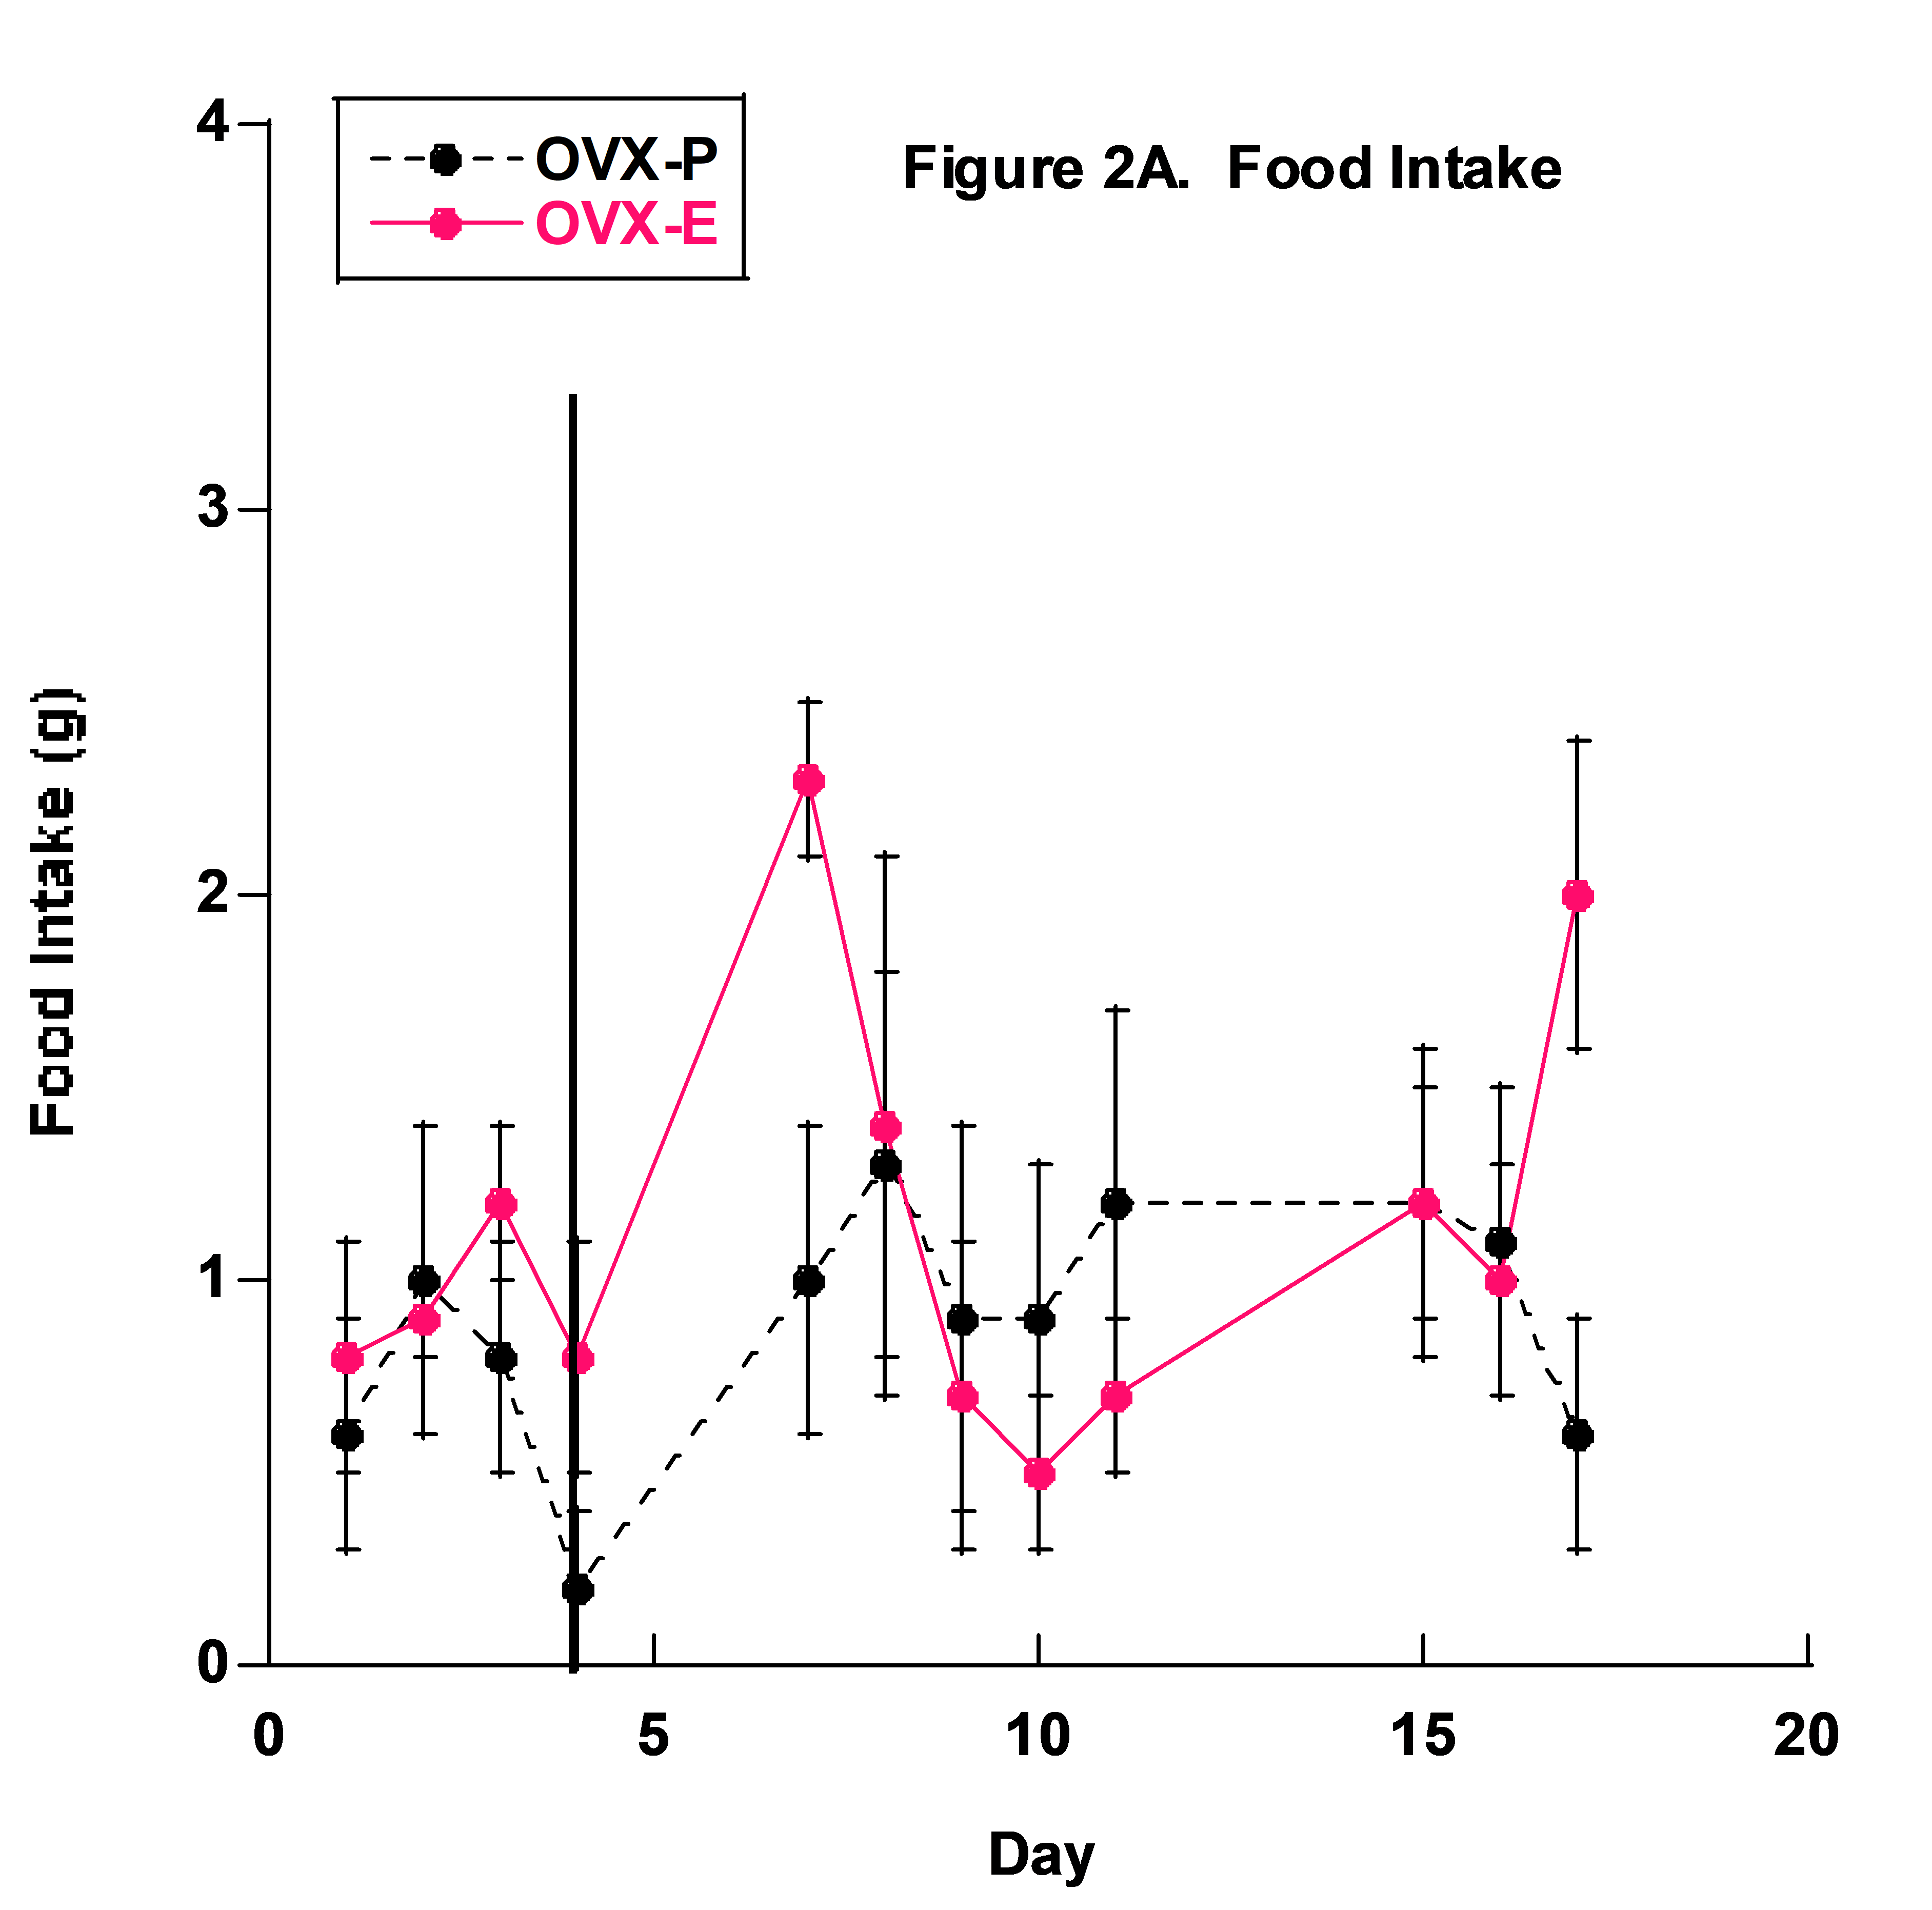
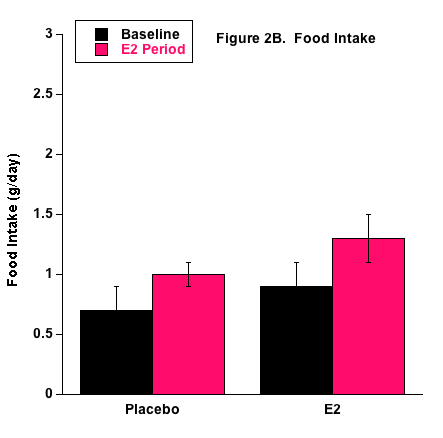
No differences in food intake were measured and overall food consumption was low in both groups (Fig. 2). This may have been due to a behavioral preference to drink the 1% NaCl + 20% fructose fluid as the primary source of nourishment. It is also possible that the mice developed a taste preference due to the fructose in the fluid, rather than the higher concentrated 4% NaCl food.
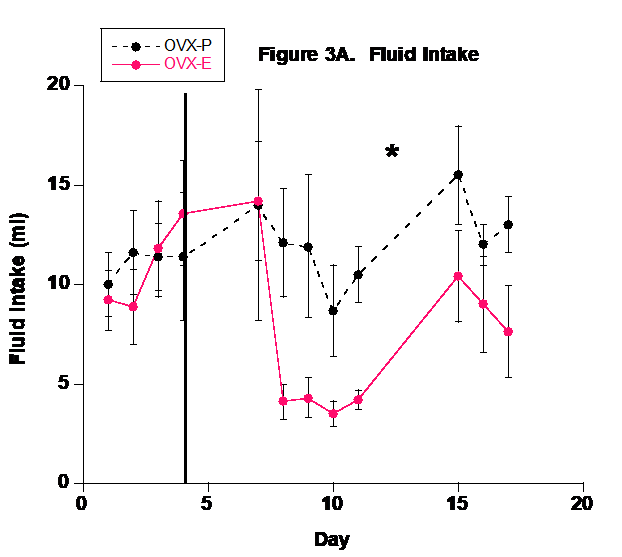
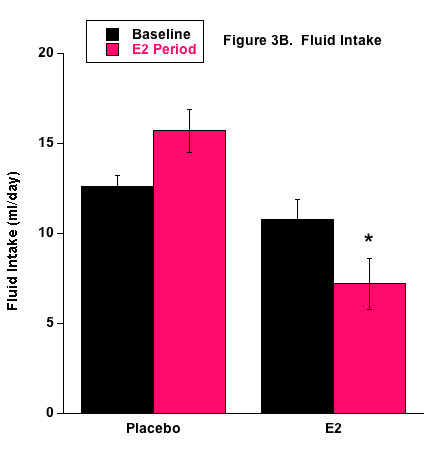
The P group drank significantly more fluid than the E2 group (Fig. 3). This could demonstrate that the E2 group’s fluid needs were satisfied more easily than the P group or it may indicate that E2 directly or indirectly inhibited the thirst centers of the hypothalamus. Numerous studies have shown that E2 affects the drinking response via central-mediated events and this may play a significant role in the regulation of blood pressure and body fluid homeostasis.32 Ovariectomy in rodents appears to increase water intake33 and E2 supplementation in OVX rodents reduces water intake.34-37 It is well known that increased plasma osmolality stimulates thirst and E2 supplementation reduces hypertonicity-induced drinking in OVX rats.38 Female rodents have a hormonal cycle and it appears that the phase with higher E2 levels, i.e., estrous phase, decreases water intake.39,40 Overall then, it certainly appears that E2 reduces fluid intake and we propose that the reduced fluid intake in the E2 group in this study further demonstrates that E2 supplementation via the 0.7 mg pellet induced physiological effects.
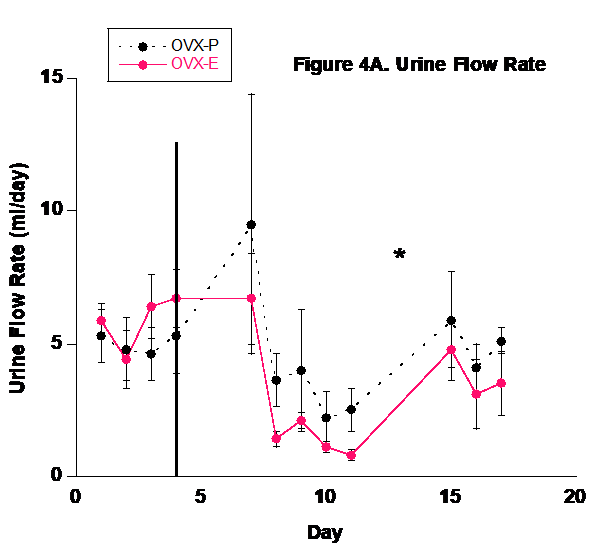
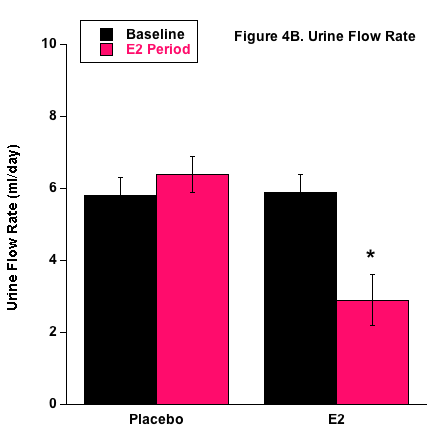
Urine flow rate followed the fluid intake profile (Fig. 4). Because of the basic balance concept (Input = Output), fluid balance in the body is achieved by matching urinary output with dietary input and metabolism. Although sweating, salivation, and defecation play a role in fluid output, urinary output is the predominant component involved in fluid homeostasis in mammals.
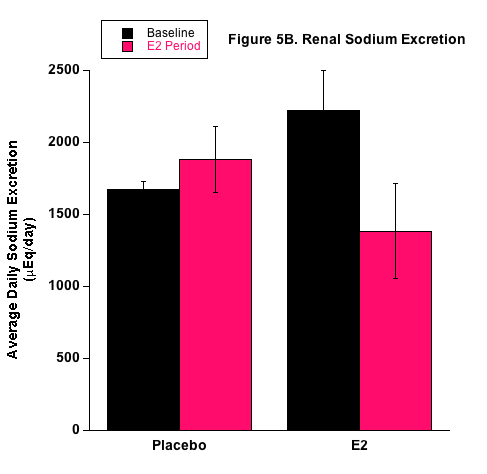
E2 treatment appeared to affect sodium balance and the renal handling of sodium (Fig.5) and these results are consistent with our previous studies that employed the 1.5 mg E2 pellet.26 With the higher fluid intake by the P group, these mice actually had higher sodium retention measured by the higher positive sodium balance. Interestingly though, the proportion of ingested sodium that was excreted by the kidneys (Nae/Nai ratio) was reduced in E2-treated mice. This supports our position that E2 increases renal sodium absorption under high salt consumption. It is possible that E2 directly upregulates renal sodium transporters that are responsible for sodium reabsorption in the nephron. Another possibility is that renal hemodynamics were influenced under E2 treatment in a way to decrease sodium excretion. This is unlikely since prevailing evidence of E2-induced vasodilation would elevate renal sodium excretion. Based on our qPCR results, we propose an E2-mediated direct effect on sodium transporters. The molecular expression data shown in Table 1 demonstrate support for E2-induced stimulation of renal sodium transport from the increased mRNA expression of the renal NKCC2 and ENaC transporters. Both are well-known renal sodium transporters involved in blood pressure regulation and are often the target of diuretic therapy for treating hypertension. Moreover, Veiras et al. demonstrated interesting sex differences in renal transporter expression in rats.41 Brunette and Leclerc showed that estrogen decreases calcium transport but increases sodium transport rabbit kidney tubules.42 We are currently conducting studies to investigate E2 receptors and E2-mediated transport properties in specific nephron segments associated with the different sodium transporters. Transport studies also need to be conducted relative to fructose. Treatment of diabetes now includes inhibition of the sodium-glucose cotransporter (SGLT2) in the kidney with drugs such as dapagliflozin (brand name Farxiga). Unlike galactose, fructose does not bind to the SGLT2 and thus, specific binding compounds will need to be developed to inhibit the fructose-binding GLUT5 protein facilitative transporter.
No differences in MAP were observed between the two groups (Fig. 6). Numerous studies have examined the effect of E2 treatment on blood pressure in rodents with no definite conclusions. Some have shown an E2-induced decrease43-45 and others have shown no effect or even an increase in blood pressure.46,47 Conflicting results in this regard are likely due to methodological differences, hormonal status related at the time of study, age of the rodents at the time of study, among other confounding variables. Vigorous debate continues on the potential benefits and detriments of hormonal replacement therapy in menopause. Ongoing studies in our lab indicate that CD-1 mice demonstrate resistance to salt-induced increases in blood pressure at least on a short-term (up to 3 months) basis and gonadectomy appears not to affect blood pressure. However, in a previous research project in our lab, consuming the HSHF diet led to an increase in MAP in intact female mice within two weeks.31 We suspect differences would have occurred in the present study if it had a longer duration.
All scientific studies and in particular “pilot” studies contain limitations. Certainly, the short duration of the study prevents any interpretation on long-term effects of the experimental conditions. Exogenous and continuous administration of E2 via the implanted pellet may not produce the same results as endogenous E2 secreted via pulsatile cycling. The absence of any period of dietary control where mice consumed normal diet with water is a limitation. The lack of blood pressure measurements in the baseline period and the absence of absolute E2 values are others. However, dietary control studies, plasma E2 measurements, and blood pressure measurements under baseline conditions, HSHF dietary conditions, and recovery periods of control diet are underway.
In summary, we set out to investigate the effects of E2 on the renal handling of sodium and blood pressure in OVX mice by employing a 0.7 mg E2 pellet to administer the steroid and observe the effectiveness of this pellet in comparison with earlier studies that used a larger and smaller size pellet. We observed significant differences in the fluid intake and in particular, in the renal handling of sodium in a manner that supports our position that E2 either directly or indirectly causes sodium retention under high salt consumption. Further studies are required to arrive at definite conclusions on the effects of E2 on the renal handling of sodium and blood pressure regulation. Although it was a short-term study, the lack of any abnormal effects previously seen with the 1.5 mg E2 pellet and the significant effects on fluid intake, sodium transport, and molecular expression of renal sodium transporters suggest that long-term studies can now be conducted with the 0.7 mg E2 pellet.
Fryar CD, Ostchega Y, Hales CM, Zhang G, Kruszon-Moran D. Hypertension Prevalence and Control Among Adults: United States, 2015-2016. NCHS Data Brief. 2017(289):1-8.
2. Geiss LS, Kirtland K, Lin J, et al. Changes in diagnosed diabetes, obesity, and physical inactivity prevalence in US counties, 2004-2012. PLoS One. 2017;12(3):e0173428.
3. Seixas AA, Henclewood DA, Langford AT, McFarlane SI, Zizi F, Jean-Louis G. Differential and Combined Effects of Physical Activity Profiles and Prohealth Behaviors on Diabetes Prevalence among Blacks and Whites in the US Population: A Novel Bayesian Belief Network Machine Learning Analysis. J Diabetes Res. 2017;2017:5906034.
4. Gordish KL, Kassem KM, Ortiz PA, Beierwaltes WH. Moderate (20%) fructose-enriched diet stimulates salt-sensitive hypertension with increased salt retention and decreased renal nitric oxide. Physiological Reports. 2017;5(7):e13162.
5. Marriott BP, Cole N, Lee E. National estimates of dietary fructose intake increased from 1977 to 2004 in the United States. J Nutr. 2009;139(6):1228S-1235S.
6. Hayes JE, Sullivan BS, Duffy VB. Explaining variability in sodium intake through oral sensory phenotype, salt sensation and liking. Physiology Behavior. 2010;100(4):369-380.
7. Soleimani M, Alborzi P. The role of salt in the pathogenesis of fructose induced hypertension. Int J Nephrol. 2011;Epub: doi: 104061/2011/392708.
8. Fu Y, Vallon V. Mineralocorticoid-induced sodium appetite and renal salt retention: evidence for common signaling and effector mechanisms. Nephron Physiol. 2014;128:8-16.
9. Morris RC, Schmidlin O, Sebastian A, Tanaka M, Kurtz TW. Vasodysfunction that involves renal vasodysfunction, not abnormally increased renal retention of sodium, accounts for the initiation of salt induced hypertension. Circulation. 2017;133(9):881-893.
10. Carlström M, Wilcox CS, Arendshort WJ. Renal autoregulation in health and disease. Physiology Review. 2015;95(2):405-511.
11. Klein VA, Kiat H. The mechanisms underlying fructose induced hypertension: a review. J Hypertens. 2015;33(5):912-930.
12. Sandberg K, Ji H. Sex differences in primary hypertension. Biology of sex differences. 2012;3(7).
13. Reckelhoff JF. Gender differences in the regulation of blood pressure. Hypertension. 2001;37(5):1199-1208.
14. Reckelhoff JF, Zhang H, Srivastava K, Granger JP. Gender differences in hypertension in spontaneously hypertensive rats. Hypertension. 1999;34(2):920-923.
15. Ojeda NP, Intapad S, Alexander BT. Sex differences in the developmental programming of hypertension. Acta Physiol. 2015;210(2):307-316.
16. Sabolić I, Asif AR, Budach WE, Wanke C, Bahn A, Burckhardt G. Gender differences in kidney funtion. Pflügers Arch. 2007;455:397-429.
17. Sharma N, Li L, Ecelbarger CM. Sex differences in renal and metabolic responses to a high-fructose diet in mice. Am J Physiol Renal Physio. 2015;308:F400-F410.
18. Livak KJ, Schmittgen TD. Analysis of relative gene expression data using real-time quantitative PCR and the 2-DDCT method. Methods. 2001;25:402-408.
19. Feng M, Whitesall S, Zhang Y, Beibel M, D'Alecy L, Dipetrillo K. Validation of volume-pressure recording tail-duff blood pressure measurements. Am J Hyper. 2008;doi 10.1038/ajh.301:301-310.
20. Aljunaidy MM, Morton JS, Cooke CL, Davidge ST. Maternal vascular responses to hypoxia in a rat model of intrauterine growth restriction. Am J Physiol Regul Integr Comp Physiol. 2016;311(6):R1068-R1075.
21. Mishra JS, Hankins GD, Kumar S. Testosterone downregulates angiotensin II type-2 receptor via androgen receptor-mediated ERK1/2 MAP kinase pathway in rat aorta. J Renin Angiotensin Aldosterone Syst. 2016;17(4).
22. Riera M, Anguiano L, Clotet S, et al. Paricalcitol modulates ACE2 shedding and renal ADAM17 in NOD mice beyond proteinuria. Am J Physiol Renal Physiol. 2016;310(6):F534-546.
23. Wang H, Sun X, Chou J, et al. Cardiomyocyte-specific deletion of the G protein-coupled estrogen receptor (GPER) leads to left ventricular dysfunction and adverse remodeling: A sex-specific gene profiling analysis. Biochim Biophys Acta. 2017;1863(8):1870-1882.
24. Couchepin C, Le KA, Bartolotti M, et al. Markedly blunted metabolic effects of fructose in healthy young female subjects compared to male subjects. Diabetic Care. 2008;31(6):1254-1256.
25. Kim SY, Joo SJ, Shin MS, et al. Clinic and home blood pressure lowering effect of an angiotensin receptor blocker, Fimasartan, in postmenopausal women with hypertension. Medicine. 2016;95(22):e3764.
26. Rouch AJ, Curtis KS, Fan L, Kudo L, Toal S, Naukam R. Estrogen supplementation in female mice yields higher sodium retention than that of testosterone in male mice. FASEB J. 2012;26:1096-1098A.
27. Grady D, Herrington D, Bittner V, et al. Cardiovascular disease outcomes during 6.8 years of hormone therapy: Heart and Estrogen/progestin Replacement Study follow-up (HERS II). J Am Med Assoc. 2002;288:49-57.
28. Herrington DM. The HERS trial results: paradigms lost? Heart and Estrogen/progesti Replacement Study. Ann Int Med. 1999;131:463-466.
29. Reckelhoff JF, Yanes LL, Iliescu R, Fortepiani LA, Granger JP. Testosterone supplementation in aging men and women: possible impact on cardiovascular-renal disease. Am J Physiol Renal Physiol. 2005;289:F941-F948.
30. Khalil R. Estrogen, vascular estrogen receptor and hormone therapy in postmenopausal vascular disease. Biochem Pharmacol. 2013;82(12):1627-1642.
31. Fan L, Saberi A, Dehghani A, Watauruocha C, Kudo L, Rouch AJ. Estrogen does not protect ovariectomized mice from increased blood pressure and sodium retention induced by high fructose and high salt diet. FASEB J. 2016;30(1):731.736.
32. Santollo J, Daniels D. Control of fluid intake by estrogens in the femal rat: rote of the hypothalamus. Front Syst Neurosci. 2015;9:25.
33. Tarttelin MF, Gorski RA. Variations in food and water intake in the normal and acyclic female rat. Physiol Behav. 1971;7(6):847-852.
34. Jonklaas J, Buggy J. Angiotensin-estrogen interaction in female brain reduces drinking and pressor responses. Am J Physiol. 1984;247(1 Pt 2):R167-172.
35. Scheidler MG, Verbalis JG, Stricker EM. Inhibitory effects of estrogen on stimulated salt appetite in rats. Behav Neurosci. 1994;108(1):141-150.
36. Spiteri NJ, Drewett RF, Padel U. Behavioral effects of ethynyl estrogens in the female rat. Physiol Behav. 1980;25(3):409-415.
37. Stricker EM, Thiels E, Verbalis JG. Sodium appetite in rats after prolonged dietary sodium deprivation: a sexually dimorphic phenomenon. Am J Physiol. 1991;260(6 Pt 2):R1082-1088.
38. Jones AB, Curtis KS. Differential effects of estradiol on drinking by ovariectomized rats in response to hypertonic NaCl or isoproterenol: Implications for hyper- vs. hypo-osmotic stimuli for water intake. Physiol Behav. 2009;98(4):421-426.
39. Antunes Rodrigues J, Covian MR. Hypothalamic Control of Sodium Chloride and Water Intake. Acta Physiol Lat Am. 1963;13:94-100.
40. Eckel LA, Houpt TA, Geary N. Spontaneous meal patterns in female rats with and without access to running wheels. Physiol Behav. 2000;70(3-4):397-405.
41. Veiras LC, Girardi ACC, Curry J, et al. Sexual Dimorphic Pattern of Renal Transporters and Electrolyte Homeostasis. J Am Soc Nephrol. 2017;28(12):3504-3517.
42. Brunette MG, Leclerc M. Effect of estrogen on calcium and sodium transport by the nephron luminal membranes. J Endo. 2001;170:441-450.
43. Chappell MC, Westwood BM, Yamaleyeva LM. Differential effects of sex steroids in young and aged female mRen2.Lewis rats: a model of estrogen and salt-sensitive hypertension. Gend Med. 2008;5(Suppl A):S65-S75.
44. Cohen JA, Lindsey SH, Pirro NT, Brosnihan KB, Gallagher PE, Chappell MC. Influence of estrogen depletion and salt loading on renal angiotensinogen expression in the mRen(2).Lewis strain. Am J Physiol Renal Physiol. 2010;299:F35-F42.
45. Xue B, Pamidimukkala J, Hay M. Sex differences in the development of angiotensin II-induced hypertension in conscious mice. Am J Physiol Heart Circ Physiol. 2005;288:H2177-H2184.
46. Hutchens MP, Nakano T, Kosaka Y, et al. Estrogen is renoprotective via a nonreceptor-dependent mechanism after cardiac arrest in vivo. Anesthesiology. 2010;112(2):305-405.
47. Yamaleyeva LM, Pendergrass KD, Pirro L, Gallagher PE, Groban L, Chappell MC. Ovariectomy is protective against renal injury in the high-salt-fed older mRen2.Lewis rat. Am J Physiol Heart Circ Physiol. 2007;293:H2064-H2071.